. 2005 Sep;16(9):4398-409.
doi: 10.1091/mbc.e04-11-1019. Epub 2005 Jun 22.

Inhibition of Pkhd1 impairs tubulomorphogenesis of cultured IMCD cells

Affiliations

Inhibition of Pkhd1 impairs tubulomorphogenesis of cultured IMCD cells

Weiyi Mai et al. Mol Biol Cell. 2005 Sep.

Abstract

Fibrocystin/polyductin (FPC), the gene product of PKHD1, is responsible for autosomal recessive polycystic kidney disease (ARPKD). This disease is characterized by symmetrically large kidneys with ectasia of collecting ducts. In the kidney, FPC predominantly localizes to the apical domain of tubule cells, where it associates with the basal bodies/primary cilia; however, the functional role of this protein is still unknown. In this study, we established stable IMCD (mouse inner medullary collecting duct) cell lines, in which FPC was silenced by short hairpin RNA inhibition (shRNA). We showed that inhibition of FPC disrupted tubulomorphogenesis of IMCD cells grown in three-dimensional cultures. Pkhd1-silenced cells developed abnormalities in cell-cell contact, actin cytoskeleton organization, cell-ECM interactions, cell proliferation, and apoptosis, which may be mediated by dysregulation of extracellular-regulated kinase (ERK) and focal adhesion kinase (FAK) signaling. These alterations in cell function in vitro may explain the characteristics of ARPKD phenotypes in vivo.


Figures
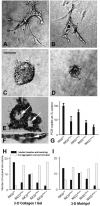
Figure 1.
Figure 1.
Tubulomorphogenesis of 3-D cultured IMCD cells transiently transfected with dsRNA against FPC. Phase-contrast photomicrographs were taken of examples of wild-type and Pkhd1-silenced IMCD cells cultured for 7 d in 3-D CI gels (A-D). Tubulomorphogenesis was seen in IMCDWT cells (A and B) but not Pkhd1-silenced IMCD cells (C and D). The tubular lumen was formed under the 3-D culture systems (arrows in E and F). (G) The levels of Pkhd1 mRNA in IMCD cells transiently transfected with Pkhd1siRNAs, including siRNA1, siRNA2, siRNA3 or a mixture of the three called siRNA1-3 (Table 1), were quantified by Real Time PCR Detection System and significant differences were seen between nontransfected and transient transfected cells (* p < 0.01). The tubulogenic results from 3-D cultures with CI gels (H) and MG gels (I) are shown. The black bars in H and I refer to tubulogenic structures similar to those seen in A and B and the white bars are cysts or cell aggregates like those seen in C and D. Bar, (A-F) 20 μm.
Figure 2.
Figure 2.
Establishment of stable Pkhd1-silenced IMCD cell lines. (A) Pkhd1-siRNA3 (Table 1) was inserted into the pSUPER-GFP/Neo vector (sh), which provided the shRNA backbone and was named Pkhd1shRNA3. To establish stable control cell lines, two nucleotides in the middle of the duplex were mutagenized from GC to AA, and this was called Pkhd1shRNA3M. The pSUPER-GFP/Neo empty vector was also used to produce control cell lines, IMCDsh. (B-D) A monoclonal antibody (mAb) against the N-terminal portion of FPC, hAR-Nm3G12, was used to stain all the tested cell lines. Positive immunoreactivity of the basal bodies/cilia appears as spots (arrows in B-D). The Pkhd1-silenced lines, IMCDshRNA3e11 (C) and IMCDshRNA3e23 (D), showed a significant decrease of FPC in that they had fewer and smaller spots of immunoreactivity than IMCDWT (B). The merged confocal images (E-H) in which IMCD-derived cell lines were costained with rhodamine-phalloidin and a mAb against the C-terminal portion of FPC, hAR-C2m3C10, also showed tremendous reduction of FPC immunoreactivity in the Pkhd1-silenced cell lines (G and H), when compared with control cell lines (arrows in E and F). pEGFP-Tub MDCK cells (I), in which EGFP was stably coexpressed with human α-tubulin, were stained with an anti-FPC mAb, hAR-C2m3C10 (J). Confocal merged images showed FPC staining was highly agglomerated at the basal bodies of the cells (arrows in J), whereas primary cilia of the cells (arrows in I) were marked by EGFP-expressed α-tubulin, suggesting that FPC localizes to the vicinity of the basal bodies of cultured renal epithelial cells (arrows in K). (L) The knockdown cell lines (IMCDshRNA3e11 and IMCDshRNA3e23) were subjected to Western blotting analysis with a panel of mono- and polyclonal antibodies against FPC. The cell lines showed a significant reduction of FPC protein expression when compared with the wild-type cell line IMCDWT. Protein loading was showed by antitubulin antibody in the same Western blots. (M) Quantitative PCR showed that the levels of Pkhd1 mRNA in the IMCDshRNA3e11 and IMCDshRNA3e23 cell lines were significantly lower than in the wild-type and empty-vector IMCDsh control (p < 0.001). Notably, the level of mRNA for Pkhd1 was slightly decreased at ∼75% of the wild-type and mutagenized control cell line (IMCDshRNA3M5). Bars, (B-H) 15 μm, (I-K) 5 μm.
Figure 3.
Figure 3.
Tubulomorphogenesis is inhibited in Pkhd1-silenced IMCD cell lines in 3-D cultures. All the tested cell lines were grown in 3-D CI (A) and MG (B) gels as described in Figure 1. A significantly higher rate of cyst formation and cell aggregation was seen in the IMCDshRNA3e11 and IMCDshRNA3e23 cells when compared with either wild-type cells or the mutagenized controls IMCDshRNA3M5, IMCDshRNA3M9 (p < 0.001). The bars and error lines represent the mean and SE of three experiments performed in triplicate.
Figure 4.
Figure 4.
Reduction of FPC alters cell-cell adhesion and disorganizes the actin cytoskeleton. (A) Wild-type (IMCDWT), empty vector control (IMCDsh21), mutagenized control (IMCDshRNA3M5), and knockdown (IMCDshRNA3e23) IMCD cells were stained with an antibody to E-cadherin. Confocal images stained with anti-E-cadherin antibody indicated a diffused E-cadherin distribution in cultured Pkhd1-silenced cells (A, d-e). Costaining with a dye for nucleic acids, YO-PRO was used in Ae. (B) Tight junction integrity was assessed in the same set of cells tested in A using an anti-ZO-1 antibody. (C) Transepithalial resistance (TER) of the same panel of the cell lines was measured on transwells over a 6-d period. Values showed represent the mean and SD of at least three independent experiments. Significant differences of TER in Pkhd1-silenced IMCD cells were observed after 3 d of culture. (* p < 0.05). (D) The actin cytoskeleton in IMCDWT, IMCDshRNA3M5, and IMCDshRNA3e23 cell lines was stained using rhodamine-phalloidin. Bars, (A, B, and D) 5 μm.
Figure 5.
Figure 5.
Reduction of FPC induces cell scattering. (A) Wild-type (IMCDWT), mutagenized control (IMCDshRNA3M5), and knockdown (IMCDshRNA3e11 and IMCDshRNA3e23) cell lines were grown in 0.5% FCS to confluence on plastic plates and a wound was produced by scratching. Time-lapse images of the wound gaps were taken at initiation of the wounding (a-d) and 10 h after wounding (e-h). The knockdown cell lines (g and h) showed slightly more healing than the wild-type (e) and mutagenized control cell lines (f); however, only IMCDshRNA3e11 cell lines had a statistical difference from the wild-type and mutagenized control cell lines (* p < 0.05 in B). Notably, the submarginal cells in the Pkhd1-silenced IMCD cell lines markedly exhibited loose cell contacts (arrows in g and h) and a lamellipodial appearance compared with the control cell lines (e and f). (C) IMCD cells with or without Pkhd1-silencing were placed onto gelatin-coated plates and subjected to time-lapse recording for 3 h. At least five single individual cell for the tested cell lines were traced and their migration rates were shown (E; * p < 0.01). (D) Video recordings were also performed on the same panel of cell lines. The studies were initiated 1 h after seeding the cells (a, d, and g). Further photographs at 10 h (b, e, and h) and 20 h (c, f, and i) were taken. Wild-type (IMCDWT) and mutagenized control (IMCDshRNA3M5) cell lines exhibited collective cell migration (d-i), whereas the Pkhd1-silenced IMCD cell lines clearly displayed spontaneous cell scattering (a-c). Bars, (A) 20 μm, (D) 15 μm. A movie of these cell behaviors are presented in Supplementary Videos S1-S3.
Figure 6.
Figure 6.
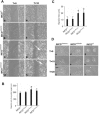
Reduction of FPC decreases integrin-dependent adhesion on CI. (A) Adhesion assays were performed on CI-coated plates as described in Materials and Methods. The values shown represent the mean and SD of at least three independent experiments. Significant differences of CI-dependent cell adhesion were seen between the Pkhd1-silenced cells and wild-type/controls. (B) CI-induced migration assays were performed on transwell filters as described in Materials and Methods. The absolute number of cells that migrated to the underside of the transwell is shown on the y-axis. There were significant differences in CI-induced cell migration between cells with and without Pkhd1-silencing (* p < 0.001).
Figure 7.
Figure 7.
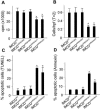
Down-regulation of FPC alters the proliferation and apoptosis of IMCD cells. (A) Wild-type (IMCDWT), mutagenized (IMCDshRNA3M5 and IMCDshRNA3M9), and knockdown (IMCDshRNA3e11 and IMCDshRNA3e23) IMCD cells were grown in 3-D CI gel for 2 d and then incubated with [3H]thymidine, after which the rate of [3H]thymidine incorporation was determined as described in Materials and Methods. [3H]thymidine values were significantly different between cells with and without Pkhd1-silencing (* p < 0.01). (B) The same tested cells were grown in 96-well plates with the same number of cells per well. Cell proliferation was evaluated according to the procedure in the manual for the Quick Cell Proliferation Assay Kit. Differences in cell proliferation rates were obtained between cells with and without Pkhd1-silencing (* p < 0.01). (C) All the tested cells were grown in 3-D CI gels; they were then fixed and subjected to TUNEL assays to assess apoptosis as described in Materials and Methods. The values represent the percentage of apoptotic cells relative to the total number of cells in the gels. Differences between cells with and without Pkhd1-silencing were significant (* p < 0.001). (D) All tested IMCD cells were grown in 60-mm plates with the same number of cells per plate for 24 h. An Annexin V-PE staining kit (BioVision) was used to measure the apoptosis rate, according to the manufacturer's instructions. After incubation for 5 min at 37°C, the fluorescence intensity was determined using flow cytometry. An increase in the fluorescence intensity was seen in the Pkhd1-silenced cells (* p < 0.001). Bars and error lines are the mean and SE of three experiments performed in triplicate.
Figure 8.
Figure 8.
Inhibition of FPC arrested ciliogenesis in cultured Pkhd1-silenced IMCD cells. (A) SEM showed that the primary cilia (arrows in A) of cultured wild-type IMCD cells. (B) The ciliary structure disappeared in majority of Pkhd1-silenced IMCD cells under same cultured condition. (C-G) A common ciliary maker anti-acetylated α-tubulin antibody was used to stain the tested cells in transwell culture. (C) Clear-cut ciliary structures were abundantly observed in wild-type IMCD cells. (D) Few ciliary staining was seen in Pkhd1-silenced IMCD cells (IMCDshRNA3e23). Green YO-PRO was used for nucleic staining. The confocal images also showed a significant decreased and shorten ciliary structure (arrows in E-G) in IMCDshRNA3e23 cells (G) compared with control cell lines IMCDsh21 (E) and IMCDshRNA3M5 (F). The confocal lateral views (lower sections in E-G) were composed by multiple sections (∼0.5-μm thick and up to 16 layers) which were projected onto one plane for presentation of ciliary staining patterns. (H) One hundred individual cells from five randomly picked high-power fields (1000×) were numbered; their ciliary staining and the positive cilium-staining rate are shown in H (* p < 0.001). Bars, (C-D) 15 μm, (E-G) 5 μm.
Figure 9.
Figure 9.
Pkhd1-silenced cells have decreased phosphorylation of ERK and FAK. Wild-type (IMCDWT), vector control (IMCDsh21), and Pkhd1-silenced (IMCDshRNA3e23) cells were serum-starved for 12 h, trypsinized, and left in suspension or replated on 10 μg/ml collagen I for 10, 30, or 60 min. Equal amounts of cell lysate were separated by 10% SDS-PAGE and transferred to nitrocellulose. The membranes were immunoblotted with antibodies to phospho-ERK1/2 (p-ERK1/2) and total ERK (T-ERK1/2) (A) or phospho-FAKpY861 (FAKpY861) and total FAK (T-FAK) (B). A normalized quantitative analysis at the indicated times was performed using the densitometry values in the Western blots for FAK pY861 (C).

Similar articles

Cited by

References

    1. Ambros, V. (2004). The functions of animal microRNAs. Nature 431, 350-355. - PubMed
    1. An, J., Chen, Y., Huang, Z. (2004). Critical upstream signals of cytochrome C release induced by a novel bcl-2 inhibitor. J. Biol. Chem. 279, 19133-19140. - PubMed
    1. Balda, M. S., and Matter, K. (2003). Epithelial cell adhesion and the regulation of gene expression. Trends Cell Biol. 13, 310-318. - PubMed
    1. Berridge, M. V., Tan, A. S., McCoy, K. D., and Wang, R. (1996). The biochemical and cellular basis of cell proliferation assays that use tetrazolium salts. Biochemica 4, 12-20.
    1. Boletta, A., Qian, F., Onuchic, L. F., Bhunia, A. K., Phakdeekitcharoen, B., Hanaoka, K., Guggino, W., Monaco, L., Germino, G. G. (2002). Polycycstin-1, the gene product of PKD1, induces resistance to apoptosis and spontaneous tubulogenesis in MDCK cells. Mol. Cell 6, 1267-1273. - PubMed

Publication types

MeSH terms

LinkOut - more resources