. 2005 Sep;16(9):4183-201.
doi: 10.1091/mbc.e04-11-0978. Epub 2005 Jun 22.

GLUT1CBP(TIP2/GIPC1) interactions with GLUT1 and myosin VI: evidence supporting an adapter function for GLUT1CBP

Affiliations

GLUT1CBP(TIP2/GIPC1) interactions with GLUT1 and myosin VI: evidence supporting an adapter function for GLUT1CBP

Brent C Reed et al. Mol Biol Cell. 2005 Sep.

Abstract

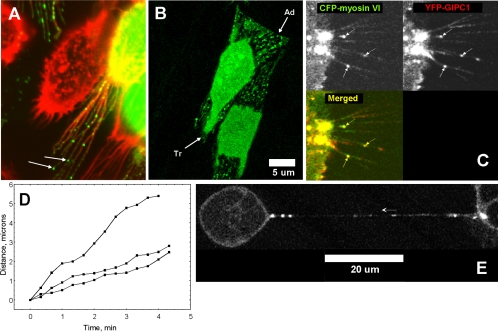
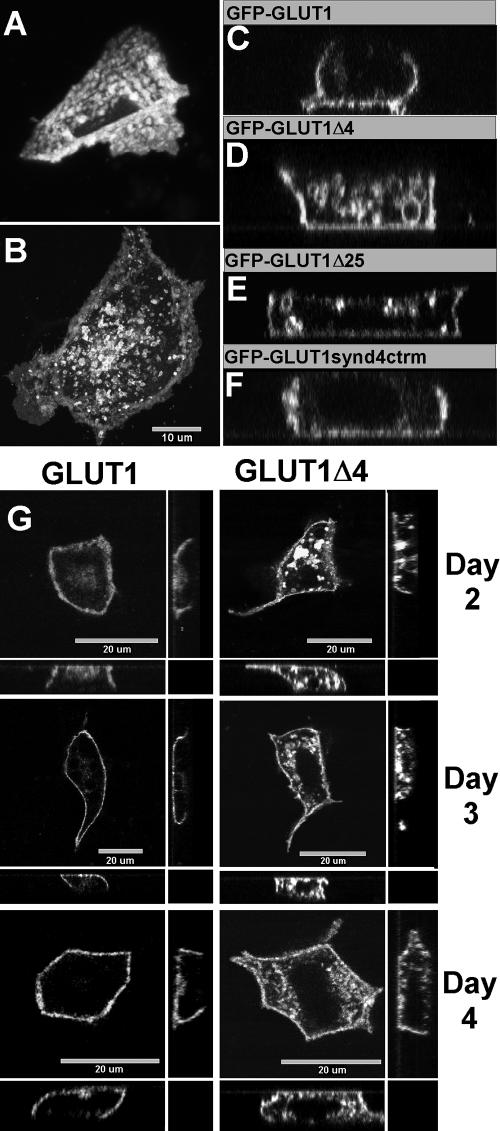
We identified a novel interaction between myosin VI and the GLUT1 transporter binding protein GLUT1CBP(GIPC1) and first proposed that as an adapter molecule it might function to couple vesicle-bound proteins to myosin VI movement. This study refines the model by identifying two myosin VI binding domains in the GIPC1 C terminus, assigning respective oligomerization and myosin VI binding functions to separate N- and C-terminal domains, and defining a central region in the myosin VI tail that binds GIPC1. Data further supporting the model demonstrate that 1) myosin VI and GIPC1 interactions do not require a mediating protein; 2) the myosin VI binding domain in GIPC1 is necessary for intracellular interactions of GIPC1 with myosin VI and recruitment of overexpressed myosin VI to membrane structures, but not for the association of GIPC1 with such structures; 3) GIPC1/myosin VI complexes coordinately move within cellular extensions of the cell in an actin-dependent and microtubule-independent manner; and 4) blocking either GIPC1 interactions with myosin VI or GLUT1 interactions with GIPC1 disrupts normal GLUT1 trafficking in polarized epithelial cells, leading to a reduction in the level of GLUT1 in the plasma membrane and concomitant accumulation in internal membrane structures.


Figures

Figure 1.
Figure 1.
Model of the proposed adapter function for GLUT1CBP(GIPC1), linking potential cargo proteins to myosin VI-catalyzed movement along F-actin filaments. (A)The C termini of GLUT1 or other potential vesicle bound cargo proteins (yellow) bind to the N-terminal region of the PDZ domain (red) of GLUT1CBP(GIPC1). This complex interacts with myosin VI through a C-terminal domain of GLUT1CBP(GIPC1) and a central domain in the tail of myosin VI (blue). Both interacting domains are marked by white boxes. A potential secondary interaction domain in GLUT1CBP(GIPC1) is marked with a dotted rectangle. The motor domain (green) of myosin VI catalyzes movement of the complex toward the negative end of the F-actin filament. A gray box marks the region containing the proline repeats in the N-terminus of GLUT1CBP(GIPC1). Numbers represent the amino acid residues within GLUT1CBP(GIPC1) and in myosin VI that are representative of the corresponding residues of the full-length GLUT1CBP(GIPC1) and pig myosin VI molecules. The two C-terminal inserts present in variant forms of myosin VI (Buss et al., 2001) are absent. (B) Three-dimensional representation of the PDZ domain of neuronal nitric-oxide synthase (nNOS) with bound peptide illustrating that the N-terminal half of the PDZ domain (red), containing the binding pocket for the C-terminal peptide (yellow), and the C-terminal portion of the PDZ domain (green) lie on opposite faces of the molecule. A similar configuration in the homologous GIPC1 molecule would provide a topology allowing cargo proteins (yellow) to bind to the PDZ domain without interference from myosin VI interactions that might involve the myosin VI binding domain D#2 (green) on the opposite face of the molecule. The structure of nNOS was derived from structural data (Tochio et al., 1999) provided by PDB ID# 1BQ8.
Figure 2.
Figure 2.
Western blots illustrating the interactions of cellular and purified GLUT1CBP(GIPC1) with the C-terminal tail of myosin VI and the formation of a trimeric complex between the myosin VI tail, GIPC1, and GLUT1. In A and B, purified GST (lanes 3 and 7) or GST-myosin VI(955-1254) (lanes 4 and 8) fusion proteins bound to glutathione-agarose beads were incubated with or without MDCK cell extracts (A) or purified His6-GLUT1CBP(GIPC1) (B) as indicated. The Western blots of bound proteins released from the washed beads were probed with rabbit anti-GIPC1 to detect associated GIPC1. Only the myosin VI(955-1254) fusion protein interacts with endogenous GIPC1 from MDCK cells (lane 4) or with purified His6-GLUT1CBP(GIPC1) (lane 8). GST beads do not interact (lanes 3 and 7) with native or purified GLUT1CBP(GIPC1), respectively. Arrows point to endogenous GLUT1CBP(GIPC1) from MDCK extracts (A) or to purified His6-GLUT1CBP(GIPC1) (B) applied directly to the gel. His6-GIPC1 (lane 8) migrates with a higher apparent molecular weight than native GIPC1 (lane 4) due to fusion protein sequences linking GIPC1 and the His6 residues (see Materials and Methods). In C, beads containing bound purified GST (lanes 11 and 13) or GST-myosin VI(955-1254) (lanes 12 and 14) were incubated with cell extracts without (lanes 11 and 12) or with (lanes 13 and 14) 40 μg of added purified His6-GIPC1 as indicated. The Western blots of bound proteins released from the washed beads were probed with rabbit anti-GLUT1 to detect associated GLUT1 transporter. Only the beads containing myosin VI(955-1254) react with endogenous GIPC1 and pull down associated GLUT1 (lane 12). This GLUT1 signal is dramatically enhanced by the addition of purified His6-GIPC1 to GST-myosin VI(955-1254) containing beads (lane 14). No GLUT1 is associated with beads containing GST (lane 11) or GST with added His6-GIPC1 (lane 13). Analysis of proteins released directly from beads containing purified GST or GST-myosin VI without incubation with cell extracts or His6-GIPC1 demonstrate no contaminants are present that cross-react with either anti-GIPC1 (lanes 1, 2, 5, and 6) or anti-GLUT1 (lanes 9 and 10) antibodies.
Figure 3.
Figure 3.
Sequences in GIPC1 critical for dimerization (or oligomer formation) and binding to myosin VI are separate and reside in respective N-terminal and C-terminal domains. Using the yeast two-hybrid system, GBD fusion proteins to full-length GIPC1(1-333), GIPC1(107-333) missing the N terminus, GIPC1(1-249) missing the C terminus, and GIPC1(107-249) retaining the PDZ domain but missing both the N and C termini, were tested for their interactions with Gal4 activation domain (ACT) fusion proteins to full-length GIPC1(1-333) and myosin VI(955-1254). The sequences comprising the PDZ domain are represented by the gray rectangle. The microtubule motor protein KIF-1B and α-actinin are known to bind to the PDZ domain of GIPC1 and serve as positive controls. Strong interactions indicated by rapid growth on -Trp, -Leu, -His plates containing 30 mM aminotriazole are designated by a “+” and no interactions (no growth) are indicated by a “-.” Loss of N-terminal GIPC1 sequences blocks only dimerization with GIPC1 (row 2), whereas loss of C-terminal sequences destroys interactions only with myosin VI (row 3). Both interactions are lost when both the N-terminal and C-terminal sequences are removed, whereas binding of the PDZ domain to KIF-1B and α-actinin is retained (row 4).
Figure 4.
Figure 4.
Mapping of the interaction domains in GIPC1 and myosin VI using a yeast two-hybrid system. DBD fusions to full-length GIPC1(1-333) or to smaller fragments tested in this study are depicted on the left side of the diagram. The sequences comprising the PDZ domain are represented by the dark gray rectangle. A plasmid expressing each of these fusion proteins was cotransfected into yeast with a selected plasmid expressing either ACT fusion protein to amino acids 955-1254 of myosin VI containing a portion of the coiled-coil domain (jagged line) and the entire tail domain (white box) or smaller regions of myosin VI as depicted across the top of the diagram. Strong interactions (indicated by rapid growth on -Trp, -Leu, -Ad plates) are designated by a “+,” weaker interactions (moderate growth) by “±,” and no interactions (no growth) are indicated by a “-.” Results defining the region to which GIPC1 binds in the myosin VI tail are presented in row 1. A single minimal interacting domain identified in the myosin VI tail is represented by the myosin VI(1065-1160) fragment and is bounded by the light gray horizontal rectangle. Two interacting domains were identified in GIPC1. The results from column 1, rows 1-6 define domain #1, which is represented by the GIPC1(261-333) fragment and is marked by the light gray vertical rectangle labeled #1. This region interacts with all Gal4 ACT fusion proteins to myosin VI containing the myosin VI(1065-1160) region, including those that also contain a portion of the coiled-coil domain (rows 4 and 5). Smaller regions (i.e., 279-333) are self-activating (SA) and because growth is no longer dependent upon interaction with a GAL4 ACT fusion protein, their interaction with myosin VI fragments cannot be evaluated in this system. The data in rows 7-16 define domain #2 and demonstrate its inability to interact with fragments containing the coiled-coil domain. Domain #2 is represented by the GIPC1(173-231) fragment and is marked by the light gray vertical rectangle labeled #2. As shown by the data in row 15, it interacts with myosin VI fragments containing a more C-terminal extension of the myosin VI (1065-1160) region, and lacking the coiled-coil domain.
Figure 5.
Figure 5.
In vitro interactions between the myosin VI C terminus and the native and truncated forms of GIPC1. (A) Autoradiogram of full-length in vitro-translated and 35S-labeled GIPC1(1-333) protein applied to the gel either directly (lane 1) or after incubation and elution from glutathione beads containing bound GST-myosin VI(1065-1160) (lane 2), GST-myosin VI(955-1254) (lane 3), or GST alone (lane 4). (B) Autoradiogram of truncated in vitro translated and 35S-labeled GIPC1(1-300) applied either directly (lane 5) or after incubation and elution from beads containing bound GST-myosin VI(955-1254) (lane 6), GST-myosin VI(1065-1254) (lane 7), or GST alone (lane 8). Labeled proteins eluted from the beads were separated by SDS-PAGE using a 10% gel. Both forms of the myosin VI C terminus that either contain (lanes 3 and 6) or are missing (lanes 2 and 7) a portion of the coiled-coil domain are able to bind both the full-length GLUT1CBP(1-333) (A) and truncated GLUT1CBP(1-300) (B) forms.
Figure 6.
Figure 6.
In the absence of domain D#1, domain D#2 in YFP-GIPC1 is insufficient for effective recruitment and colocalization with full-length or truncated forms of CFP-myosin VI in a mammalian cell system. Vectors expressing CFP-fusion proteins to either full-length (1-1254) or truncated (955-1254) myosin VI were cotransfected into CHO cells with vectors expressing either full-length (1-333) or truncated (1-249) YFP-fusion proteins to GIPC1 as indicated. Two days after transfection, images of the distribution of CFP-myosin VI fusion proteins (left column) and YFP-GIPC1 fusion proteins (middle column) and their merged images (right column) were collected using a confocal microscope focused near the midpoint of each cell. Excitation lasers and emission filters were set as described in Materials and Methods such that no significant CFP emissions were detected in the YFP channel (middle column) and no significant YFP emissions in the CFP channel (left column). Row A, distribution of full-length CFP-myosin VI(1-1254) is diffuse in cells not expressing YFP-GIPC1 (solid arrows), but in cells expressing full-length YFP-GIPC1(1-333) (dotted arrows) CFP-myosin VI redistributes into membrane bound and punctate cytosolic structures that colocalize with CFP-GIPC1. Row B, higher magnification of a CHO cell illustrating the effective redistribution and colocalization of full-length CFP-myosin VI(1-1254) with YFP-GIPC1(1-333). Full-length YFP-GIPC1(1-333) also induces the redistribution and colocalization of truncated CFP-myosin VI(955-1254) containing the C terminus and a portion of the coiled-coil domain (row D), whereas truncated CFP-GIPC1(1-249) containing domain D#2, but lacking domain D#1, fails to induce redistribution and colocalization with either full-length myosin VI(1-1254) or truncated myosin VI(955-1254) as shown in rows C and E, respectively.
Figure 7.
Figure 7.
Movement of GIPC1 and GIPC1-myosin VI complexes in CHO and 293 cells. A and B demonstrate that particles containing GFP-GIPC1 colocalize with F-actin filaments in cellular extensions of CHO cells and move toward the cell body. In A, transfected CHO cells expressing full-length GFP-GIPC1(1-333) were fixed with 2% paraformaldehyde, permeabilized with 0.2% Triton X-100, and the F-actin stained with rhodamine-phalloidin. Green particles of GFP-GIPC1 (arrows) can be observed along with F-actin (red) within the cellular extensions. In B, CHO cells were transfected with GFP-GIPC1(1-333) and images were collected from live cells at 30-s intervals using a confocal microscope. GFP-GIPC1(1-333) particles are evident in the cellular extensions shown in the still image presented in B. As illustrated in the supplemental video Fig 7B.mov constructed from the individual time-lapse images, GFP-GIPC1(1-333) particles move toward the cell body within cellular extensions protruding from both the advancing (Ad) and trailing (Tr) edge of the cell. C and D demonstrate that CFP-myosin VI and YFP-GlPC1 form complexes in 293 cells that move coordinately toward the cell body within cellular extensions. Time-lapse images of live 293 cells expressing CFP-myosin VI and YFP-GIPC1 were collected at 20-s intervals using settings for the confocal microscope like those for Figure 6 to separate CFP and YFP emissions. The beginning frame of the series is presented in C, where the CFP-myosin VI distribution is presented in the top left quadrant, YFP-GIPC1 in the top right quadrant, and the merged image in the bottom left quadrant. Three complexes (solid arrows) observable in the CFP, YFP, and merged channels indicate that expressed YFP-GIPC1 and CFP-myosin VI colocalize in the cellular extensions and move coordinately within the extensions toward the cell body. Plots of their movement indicate that the rate of movement of each of the complexes differ with the slowest moving at 0.5 μm/min and the fastest at 2.0 μm/min. Although the rates differ slightly for each of the three marked complexes (arrows), the movement of CFP-myosin VI and YFP-GIPC1 in each instance is as a single complex. The direction and coordinate nature of movement of each complex is best observed in the supplemental movie (Fig 7C.mov). E illustrates a long bridge between two 293 cells on the left and right extremes of the image that are expressing both CFP-myosin VI and YFP-GIPC1. This structure is identical in appearance to the actin-containing nanotubes reported to transport particles between adjoining cells (Rustom et al., 2004). The direction of movement of a myosin VI/YFP-GIPC1 complex is marked by an adjacent arrow. The measured velocity of this complex was 1.2 μm/min. In A-C, the images were captured within the plane of the retraction fibers near the base of the cell, and near the midpoint for the cells in E.
Figure 8.
Figure 8.
Movement of GIPC1(1-333) within cellular extensions of CHO cells is actin dependent and microtubule independent. Time-lapse images of live transfected CHO cells expressing GFP-GIPC1 were collected at 30-s intervals using a confocal microscope focused within the plane of the extended fibers near the base of each cell. GFP-GIPC1 particles were tracked using MetaMorph software to measure the distance moved during the collection period before and after the addition of the drugs colchicine (100 μM) and nocodazole (33 μM) to disrupt microtubule structure (A and B, respectively) or cytochalasin D (4 μM) and latrunculin (10 μM) to disrupt F-actin (C and D, respectively). Representative subsets of plots of the distance of individual particle movement versus time are presented in the left column. Positive slopes indicate movement toward, and negative slopes movement away, from the cell body. The images of representative cells used to collect the data and for which videos are provided are presented in the right column. The data indicate that microtubule disrupting agents (A and B) do not inhibit particle movement, and that both the F-actin-disrupting agents (C and D) block particle movement. The videos offer an enhanced view of this phenomenon and demonstrate that particle movement is toward the cell body and consistent with the direction predicted for myosin VI catalyzed movement. They also dramatically illustrate the continued movement toward the cell body of a large sampling of particles after the addition of either colchicine or nocodazole, and their block in progressive movement toward the cell body after the addition of cytochalasin D or latrunculin. Videos are presented in the supplement as Fig 8a, b, c, and d.mov. E demonstrates that coexpression of CFP-myosin VI(955-1254) lacking the motor domain with YFP-GIPC1 blocks movement of GIPC1 toward the cell body. Consistent with the model presented in Figure 1, mutant CFP-myosin VI(955-1254) by interacting with YFP-GIPC1 (see Figure 6D) blocks movement by preventing the interaction of a fully functional myosin VI with YFP-GIPC1. A video demonstrating this effect is presented in the supplement as Fig 8e.mov.
Figure 9.
Figure 9.
The C-terminal four-amino acid sequence recognized by the PDZ domain of GIPC1 is required for normal distribution of GLUT1 between the plasma membrane and intracellular membranous structures in MDCK cells. EGFP-C1 vectors driving the expression of GFP fused to the N terminus of GLUT1, GLUT1Δ4, GLUT1Δ25, and GLUT1synd4ctrm were introduced separately into monolayers of MDCK cells using Lipofectamine 2000. The expressed proteins represent, respectively, GLUT1 with the native C terminus, GLUT1 missing the last four amino acids or the last 25 amino acids, and GLUT1 with the last four amino acids replaced by the C-terminal four amino acid sequence from syndecan 4. Two days after transfection, the distribution of each GFP fusion protein was determined with a confocal microscope by collecting a series of z-section images. A and C, three-dimensional projection and X-Z plane reconstruction, respectively, demonstrating the normal basolateral distribution for GFP-GLUT1 and the normal low concentration of transporter in intracellular membranes relative to that present in the basolateral membrane. B and D, three-dimensional projection and X-Z plane reconstruction, respectively, demonstrating high concentrations of mutant GFP-GLUT1Δ4 in intracellular membranes. A comparison of the single frame images presented in A and B is best observed by viewing the three-dimensional reconstructions in the supplemental videos Fig 9A.mov and Fig 9B.mov. They effectively demonstrate the low internal GLUT1 distribution in A and the high internal GLUT1Δ4 distribution in B. (C, D, E, and F) X-Z plane reconstructions of cells expressing GFP-GLUT1, GFP-GLUT1Δ4, GFP-GLUT1Δ25, and GFP-GLUT1synd4ctrm, respectively. These results illustrate that the observed abnormal intracellular distribution of GFP-GLUT1Δ4 (D) and GFP-GLUT1Δ25 (E) relative to GFP-GLUT1 (C) reverts to a normal distribution when the missing amino acids in GFP-GLUT1Δ4 are replaced by those of syndecan 4 to form GFP-GLUT1synd4ctrm (F). The apical domain is orientated toward the top of the panel in the X-Z reconstructions presented in C, D, E, and F. Native and mutant transporters present in the plasma membrane remain in the basolateral domain with little to no targeting to the apical domain (C-F). The experiments presented in G demonstrate that extended intervals of expression do not correct the abnormal elevated intracellular distribution observed for mutant GFP-GLUT1Δ4 relative to native GFP-GLUT1. Vectors driving the expression of GFP-GLUT1 and GFP-GLUT1Δ4 were transfected into MDCK cells and analyzed as described above, at 2-, 3-, and 4-d intervals after transfection. The X-Y plane images collected near the midpoint of the cell are presented in the large panel with the associated reconstructed X-Z plane (bottom) and Y-Z plane (right) presented for each mutant and interval of expression. The apical domain is oriented toward the bottom of the X-Z image and toward the right of the Y-Z image. The contrast and brightness settings have been adjusted to enhance the visibility of the basolateral distribution of native and mutant transporters in the plasma membrane and to permit a visual comparison of the distribution of native and mutant transporters between internal and plasma membrane compartments. A quantitative comparison obtained from unprocessed images is presented in Figure 10.
Figure 10.
Figure 10.
Removal of the C-terminal four amino acids of GLUT1 or expression of the myosin VI tail in MDCK cells disrupts normal trafficking of GLUT1. An ECFP-C1 vector driving the expression of CFP fused to the N terminus of GLUT1 was introduced into MDCK cells with either an EYFP vector or an EYFP vector driving the expression of YFP fused to the N terminus of myosin VI(955-1254). Eighteen hours after transfection, the distributions of CFP-GLUT1, YFP, and YFP-myosin VI(955-1254) were determined by collecting X-Y plane images near the midpoint of the cell with a confocal microscope. (A) Image of a representative cell coexpressing CFP-GLUT1 (green) and YFP (red) illustrating that YFP expression does not alter the normal distribution of CFP-GLUT1. CFP-GLUT1 (left) is concentrated within the plasma membrane with only low levels of internal CFP-GLUT1 visible. This distribution is identical to that observed for GFP-GLUT1 expressed in the absence of YFP (Figure 9G, left, day 2). (B) Image of cells coexpressing CFP-GLUT1 (green) and YFP-myosin VI(955-1254) (red) illustrating that YFP-myosin VI(955-1254) expression disrupts the normal distribution of CFP-GLUT1. Cells expressing either no, intermediate, or high levels of YFP-myosin VI expression (middle) exhibit respectively either no, intermediate, or high levels of CFP-GLUT1 accumulation in internal membranes (respectively, marked 1, 2, or 3 in the left panel). (C) Enlarged view of the area marked by a bracket in the merged view of B. YFP-myosin VI(955-1254) (red) is associated with membranes and individual vesicles (arrows) containing inappropriately targeted CFP-GLUT1 (green). (D) Eighteen hours after transfection, z-section images were collected though the entire cell volume from five random cells expressing CFP-GLUT1 and five random cells expressing CFP-GLUT1Δ4. The total plasma membrane associated fluorescence and total cell fluorescence were integrated and summed for all z-sections and the level of plasma membrane or intracellular transporter is expressed as a percentage of the total cellular transporter. For cells transfected with CFP-GLUT1Δ4 the amount of fluorescence transporter in the plasma membrane (22.3 ± 3.2%) is significantly smaller than the amount (51.3 ± 2.4%) for cells transfected with CFP-GLUT1 (p < 0.001). Accordingly cells expressing CFP-GLUT1Δ4 display a correspondingly 1.6-fold higher internal distribution of transporter (77.7%) than those expressing CFP-GLUT1 (48.7%). (E) An experimental approach identical that of D was used to determine the average CFP-GLUT1 distribution (mean ± SE) in five cells coexpressing CFP-GLUT1 and YFP and five cells coexpressing CFP-GLUT1 and YFP-myosin VI(955-1254). The cells selected were expressing matched levels of YFP and YFP-myosin VI(955-1254). In cells expressing YFP, the level of CFP-GLUT1 in the plasma membrane was 53.2 ± 3.8% of the total cellular CFP-GLUT1. This value is nearly identical to the distribution of CFP-GLUT1 expressed in the absence of YFP (Figure 10D), demonstrating that YFP expression itself does not alter CFP-GLUT1 trafficking. For cells expressing CFP-GLUT1 and YFP-myosin VI(955-1254) the amount of fluorescence transporter in the plasma membrane (27.6 ± 2.5%) is significantly smaller than the amount (53.2 ± 3.8%) for cells expressing CFP-GLUT1 and YFP (p < 0.001). Accordingly cells expressing CFP-GLUT1 and YFP-myosin VI(955-1254) display a correspondingly 1.5-fold higher internal distribution of transporter (72.4%) than those expressing CFP-GLUT1 and YFP (46.8%). These results demonstrate that blocking the interactions of GLUT1 (GLUT1Δ4) with GIPC1 or blocking the interactions of GIPC1 with native myosin VI by overexpressing myosin VI(955-1254) both disrupt GLUT1 trafficking and raise the internal concentration of transporter to the same extent. Percentages are expressed as the mean ± SE of the mean. Error bars represent the SE of the mean.
Figure 11.
Figure 11.
GFP-GLUT1Δ4 accumulates in endosome derived compartments, primarily late endosomes and lysosomes. In all panels, MDCK cells were transfected with a vector expressing GFP-GLUT1Δ4 and after 18 h were treated to label various vesicle compartments. Images were collected at the midpoint of each cell using a confocal microscope. (A) Monolayers were exposed for 10 min to LysoTracker red to label acidic compartments, washed, and then fixed with paraformaldehyde. A majority of the large GFP-GLUT1Δ4-containing vesicles (green) contained an acidic lumen (red, pH < 5.5) marked by the LysoTracker dye. (B) An enlarged view of the region bounded by the dotted rectangle shown in A illustrating the acidic vesicles (red) bounded by membranes containing high concentrations of GFP-GLUT1Δ4. (C) Monolayers were fixed, permeabilized, and stained with a mouse anti-EEA1 antibody followed by a Cy3-conjugated goat anti-mouse IgG to label the early endosomal compartment. The image demonstrates that an appreciable number of GFP-GLUT1Δ4 containing vesicles (green) are associated with the early endosome marker EEA1 (red). (D) An enlarged view of the region bounded by the large rectangle in C that more clearly demonstrates GFP-GLUT1Δ4-containing vesicles (green) decorated by EEA1 (red). (E) To confirm that EEA1-positive vesicles were not inappropriately associated with the large number of acidic GFP-GLUT1Δ4-enriched vesicles, monolayers were pulsed for 10 min with LyosTracker red, washed, fixed, permeabilized, and incubated with mouse anti-EEA1 and Cy5-conjugated goat anti-IgG to label respective acidic and early endosomal compartments. EEA1-positive compartments (blue) do not coincide with acidic vesicles (red) containingaccumulatedGFP-GLUT1Δ4.(F)Monolayers were pulsed with RITC-dextran for 20 min then fixed to label early endosomal compartments. In this image a small number of the GFP-GLUT1Δ4 containing vesicles (green) contain RITC-dextran (red). (G) Monolayers were pulsed with RITC-dextran as in F, washed, chased for an interval of 60 min, and then fixed to label late endosomal and lysosomal structures. Much like the labeling pattern in A, a majority of vesicles enriched in GFP-GLUT1Δ4 (green) contain RITC-dextran (red).

Similar articles

Cited by

References

    1. Altman, D., Sweeney, H. L., and Spudich, J. A. (2004). The mechanism of myosin VI translocation and its load-induced anchoring. Cell 116, 737-749. - PubMed
    1. Aschenbrenner, L., Lee, T., and Hasson, T. (2003). Myo6 facilitates the translocation of endocytic vesicles from cell peripheries. Mol. Biol. Cell 14, 2728-2743. - PMC - PubMed
    1. Aschenbrenner, L., Naccache, S. N., and Hasson, T. (2004). Uncoated endocytic vesicles require the unconventional myosin, Myo6, for rapid transport through actin barriers. Mol. Biol. Cell 15, 2253-2263. - PMC - PubMed
    1. Awan, A., Lucic, M. R., Shaw, D. M., Sheppard, F., Westwater, C., Lyons, S. A., and Stern, P. L. (2002). 5T4 interacts with TIP-2/GIPC, a PDZ protein, with implications for metastasis. Biochem. Biophys. Res. Commun. 290, 1030-1036. - PubMed
    1. Blobe, G. C., Liu, X., Fang, S. J., How, T., and Lodish, H. F. (2001). A novel mechanism for regulating transforming growth factor β (TGF-β) signaling. functional modulation of type III TGF-β receptor expression through interaction with the PDZ domain protein, GIPC. J. Biol. Chem. 276, 39608-39617. - PubMed

Publication types