. 2005 Sep;16(9):4423-36.
doi: 10.1091/mbc.e04-11-0974. Epub 2005 Jun 22.

Taxol-stabilized microtubules can position the cytokinetic furrow in mammalian cells

Affiliations

Taxol-stabilized microtubules can position the cytokinetic furrow in mammalian cells

Katie B Shannon et al. Mol Biol Cell. 2005 Sep.

Abstract

How microtubules act to position the plane of cell division during cytokinesis is a topic of much debate. Recently, we showed that a subpopulation of stable microtubules extends past chromosomes and interacts with the cell cortex at the site of furrowing, suggesting that these stabilized microtubules may stimulate contractility. To test the hypothesis that stable microtubules can position furrows, we used taxol to rapidly suppress microtubule dynamics during various stages of mitosis in PtK1 cells. Cells with stabilized prometaphase or metaphase microtubule arrays were able to initiate furrowing when induced into anaphase by inhibition of the spindle checkpoint. In these cells, few microtubules contacted the cortex. Furrows formed later than usual, were often aberrant, and did not progress to completion. Images showed that furrowing correlated with the presence of one or a few stable spindle microtubule plus ends at the cortex. Actin, myosin II, and anillin were all concentrated in these furrows, demonstrating that components of the contractile ring can be localized by stable microtubules. Inner centromere protein (INCENP) was not found in these ingressions, confirming that INCENP is dispensable for furrow positioning. Taxol-stabilization of the numerous microtubule-cortex interactions after anaphase onset delayed furrow initiation but did not perturb furrow positioning. We conclude that taxol-stabilized microtubules can act to position the furrow and that loss of microtubule dynamics delays the timing of furrow onset and prevents completion. We discuss our findings relative to models for cleavage stimulation.


Figures

Figure 1.
Figure 1.
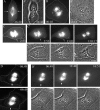
Addition of taxol stabilizes microtubules and suppresses dynamics of individual microtubules in living PtK1 cells. (A and B) Two cells are shown before (top) and after (bottom) addition of 10 μM taxol at T = 00:00. Arrowheads are fixed and provide a reference point for the growth and shrinkage of nearby microtubules in untreated cells. Arrows show stable astral microtubules after taxol addition. Contrast was enhanced for visualization of astral microtubules. Time is in minutes:seconds. Bar, 5 μm.
Figure 2.
Figure 2.
Stable microtubules lose EB1 tip localization. (A) EB1-GFP localization to growing microtubule plus ends before addition of taxol. 10 μM taxol was added at T = 00:00. (B) Localization of EB1-GFP 1 min 20 s after taxol addition shows that microtubule polymerization is still occurring. (C) EB1-GFP 5 min 20 s after taxol addition. EB1 is no longer localized to microtubule ends, but it is seen diffusely along the microtubule lattice and at spindle poles. (D) Untreated EB1-GFP cell injected with rhodamine-labeled tubulin. T = 00:00 was assigned to first image shown. Top, tubulin fluorescence. Arrow indicates a stable microtubule-cortex interaction. Middle, EB1-GFP. White box indicates region shown in bottom panel. Bottom, 2× magnification of combined tubulin (red) and EB1-GFP (green) fluorescence. Time is in minutes:seconds. Bar, 10 μm.
Figure 3.
Figure 3.
Stabilization of microtubules before anaphase onset produces three phenotypes. Cells in 10 μM taxol were injected with Mad2ΔC at T = 00:00. Asterisks indicate approximate position of spindle poles. (A) No furrow formation. After injection, the cell entered anaphase (T = 9:59) and did not furrow before respreading and entering interphase (T = 3:20:26). (B) Normal furrow positioning. The cell entered anaphase (T = 30:46) and furrowed with two ingressions, which formed perpendicular to the spindle axis. Furrows were maximally ingressed at T = 1:21:22, and one furrow regressed as the cell entered interphase (T = 1:38:03). (C) Abnormal furrow positioning. The cell formed two ingressions (T = 44:00), but the furrow did not form on a plane bisecting the spindle, because one furrow was initiated near the pole (top asterisk). Both furrows eventually regressed (T = 1:15:59) as the cell entered interphase (T = 2:12:01). Time is shown in hours:minutes: seconds. Bar, 5 μm.
Figure 4.
Figure 4.
Taxol-stablized microtubules interact with the cortex at the site of eventual furrow formation. (A) Single plane projection of deconvolved optical sections of a control cell in early anaphase after injection with Mad2ΔC and rhodamine-tubulin. Arrows show position of microtubules at the cortex before furrowing. (A′) Phase contrast image of control cell 10 min later, showing the position of the furrow. (B) Single plane projection of deconvolved optical sections of a taxol-treated cell injected with Mad2ΔC and rhodamine-tubulin that did not form a furrow. Note the lack of microtubule contacts at the cortex. (B′) Phase contrast image of cell in B showing lack of furrow formation. (C) Single plane projection of deconvolved optical sections of a taxol-treated cell injected with Mad2ΔC and rhodamine-tubulin that formed a furrow. Arrow denotes microtubule interaction with the cortex. (C′) Single plane time lapse images showing microtubules. Arrows show the position of a microtubule interacting with the cortex. Note the lack of such contacts above the spindle. (C″) Single plane time-lapse phase contrast images show furrow progression and correspond to images in C′. (D) Two single plane projections of deconvolved optical sections of a taxol-treated cell injected with Mad2ΔC and rhodamine-tubulin that formed an abnormally positioned furrow. Arrow denotes microtubule interaction with the cortex. (D′) Single plane time-lapse images showing microtubules. Arrows show the position of a microtubule interacting with the cortex. (D″) Single plane time lapse phase contrast images show furrow progression and correspond to images in D′. Cell boundaries in A, B, C, and D were drawn using corresponding phase contrast images. Time is in hours:minutes:seconds, and for A, B, C and D are the time of the first image in the Z series. Contrast has been adjusted to highlight microtubule interactions with the cortex. Bar, 10 μm.
Figure 5.
Figure 5.
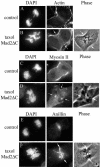
Immunolocalization of actin, myosin II, and anillin to the furrows formed in taxol-treated cells. All fluorescence images are single plane projections of deconvolved optical sections through the cell. Phase contrast images represent the last time point before fixation. (A) 4,6-Diamidino-2-phenylindole (DAPI) and phalloidin staining of control cell. Equatorial actin band looks faint because it is localized to the adherent cortex. (B) DAPI and phalloidin staining of taxol-treated, Mad2ΔC injected cell. Arrows mark site of furrowing. (C) DAPI staining and myosin II immunofluorescence in a control anaphase cell. (D) DAPI and myosin II staining of taxol-treated, Mad2ΔC-injected cell shows an accumulation of myosin II at the cortex in each of the three ingressions (arrows). (E) DAPI staining and anillin immunofluorescence in a control anaphase cell. (F) DAPI staining and anillin immunofluorescence in a taxol-treated, Mad2ΔC-injected cell. Anillin is localized to furrow region (arrows). Bar, 5 μm.
Figure 6.
Figure 6.
INCENP does not localize to furrows formed after microtubule stabilization by taxol. All fluorescence images are single plane projections of deconvolved optical sections through the cell. (A) 4,6-Diamidino-2-phenylindole (DAPI) and phalloidin staining and INCENP immunofluorescence in a control anaphase cell. (B) DAPI and phalloidin staining and INCENP immunofluorescence in a taxol-treated, Mad2 ΔC-injected cell. Notice the concentration of actin in the three ingressions (arrows). No INCENP is found at the cortex. Phase contrast image showing ingressions (arrows) is from last time point before fixation. Bar, 5 μm.
Figure 7.
Figure 7.
Stabilization of microtubules after anaphase onset does not affect furrow positioning. Taxol (10 μM) was added at T = 00:00. (A and C) Single plane projection of optical sections of GFP-tubulin images. Time is in minutes:seconds after taxol addition, and it is the time of the first image in the Z series. (B) Phase contrast images corresponding to images in A showing normal furrow positioning. (D) Phase contrast image corresponding to the last panel of C. Bar, 10 μm.
Figure 8.
Figure 8.
Analysis of midzone formation by tubulin and PRC1 immunofluorescence. All fluorescence images are single plane projections of deconvolved optical sections through the cell. (A) Untreated anaphase showing PRC1 localization to the midzone. (B) Taxol-arrested metaphase cell has diffuse PRC1 localization on the spindle. (C) Cell treated with taxol at anaphase onset. PRC1 has localized to the tips of microtubules. Phase contrast image shows furrow ingression (arrow) at the last time point before fixation. (D) Cell arrested with taxol and injected with Mad2ΔC to induce anaphase. PRC1 is concentrated on a subset of microtubules, even though the microtubules are not organized into interzonal bundles. Phase contrast image shows furrow ingression (arrows) at the last time point before fixation. (E) Cell arrested with taxol and injected with Mad2ΔC that did not furrow before exiting mitosis. Microtubule bundles with PRC1 localization persist. Phase contrast image shows the last time point before fixation. Bar, 10 μm.
Figure 9.
Figure 9.
Model for induction of furrow positioning after microtubule stabilization in metaphase versus anaphase. Left cell illustrates that stabilization of microtubules before anaphase onset leads to few, random contacts with the cortex. At anaphase onset, this results in abnormal furrow positioning. Right cell shows that normally during anaphase a subset of microtubules are relatively stable, leading to induction of the furrow at the equator.

Similar articles

Cited by

References

    1. Adams, R. R., Maiato, H., Earnshaw, W. C., and Carmena, M. (2001). Essential roles of Drosophila inner centromere protein (INCENP) and aurora B. in histone H3 phosphorylation, metaphase chromosome alignment, kinetochore disjunction, and chromosome segregation. J. Cell Biol. 153, 865-880. - PMC - PubMed
    1. Adams, R.., Tavares, A. A., Salzberg, A., Bellen, H. J., and Glover, D. M. (1998). pavarotti encodes a kinesin-like protein required to organize the central spindle and contractile ring for cytokinesis. Genes Dev. 12, 1483-1494. - PMC - PubMed
    1. Alsop, G. B., and Zhang, D. (2003). Microtubules are the only structural constituent of the spindle apparatus required for induction of cell cleavage. J. Cell Biol. 162, 383-390. - PMC - PubMed
    1. Amin-Hanjani, S., and Wadsworth, P. (1991). Inhibition of spindle elongation by taxol. Cell Motil. Cytoskeleton 20, 136-144. - PubMed
    1. Amos, L. A., and Lowe, J. (1999). How Taxol stabilises microtubule structure. Chem. Biol. 6, R65-R69. - PubMed

Publication types

Substances

LinkOut - more resources