Comparative Study
. 2005 Sep 1;567(Pt 2):471-92.
doi: 10.1113/jphysiol.2005.090084. Epub 2005 Jun 23.

Endothermic force generation, temperature-jump experiments and effects of increased [MgADP] in rabbit psoas muscle fibres

Affiliations
Comparative Study

Endothermic force generation, temperature-jump experiments and effects of increased [MgADP] in rabbit psoas muscle fibres

M E Coupland et al. J Physiol. .

Abstract

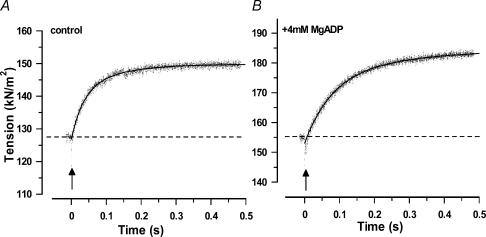
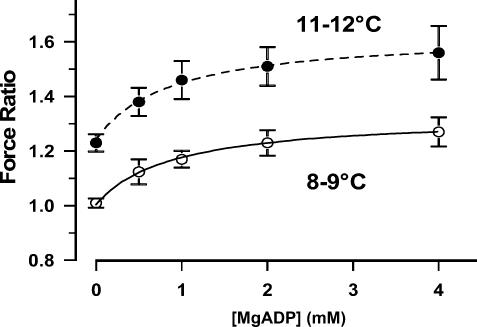
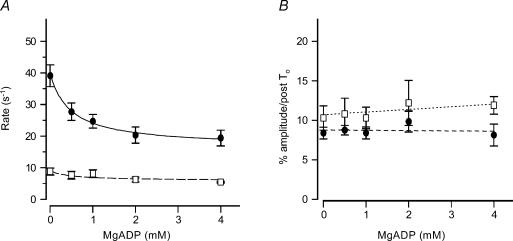
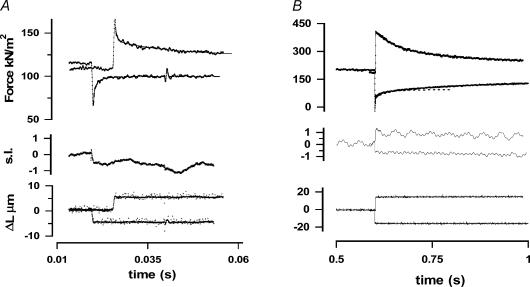
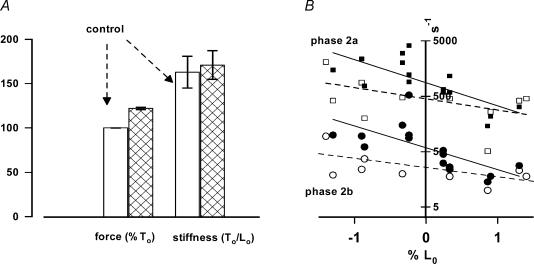
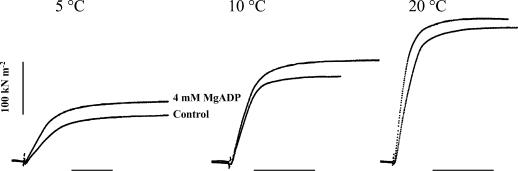
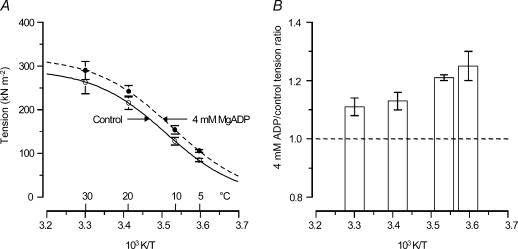
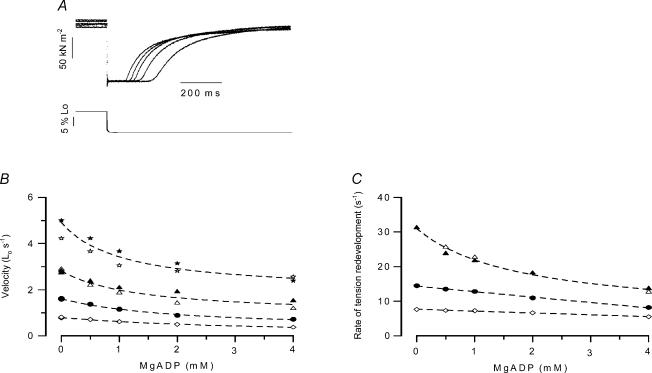
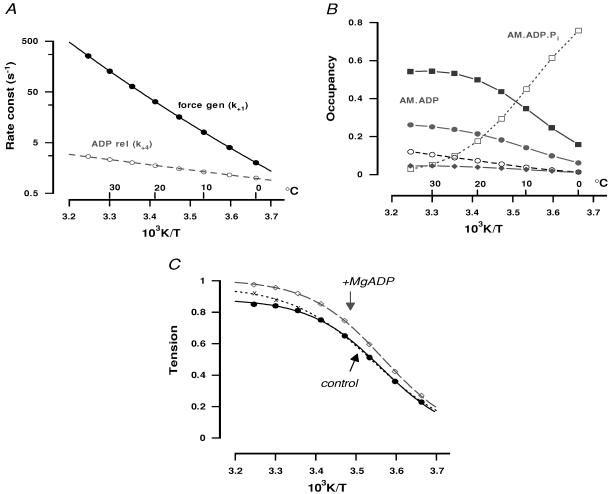
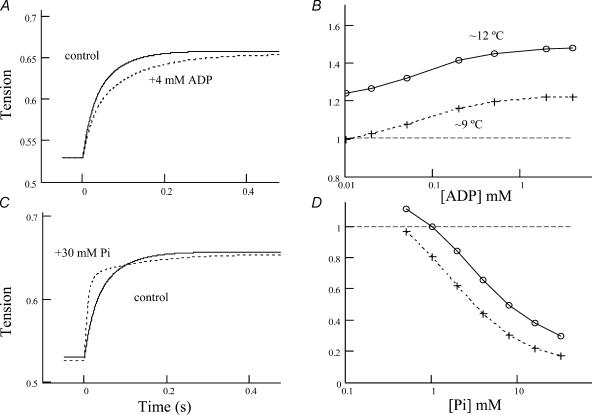
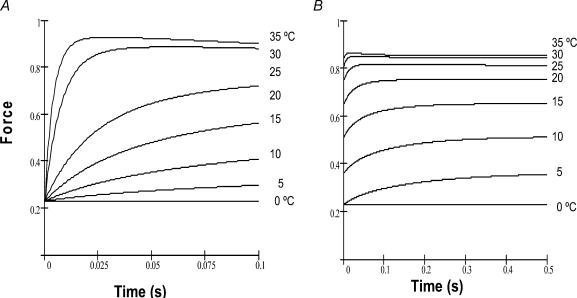
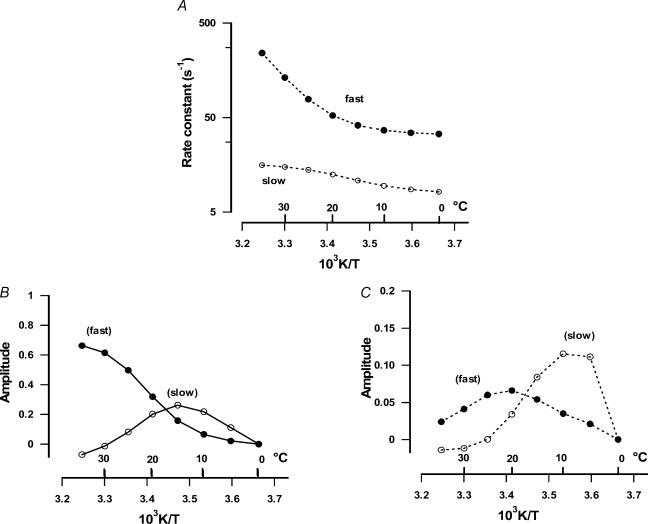
We studied, by experiment and by kinetic modelling, the characteristics of the force increase on heating (endothermic force) in muscle. Experiments were done on maximally Ca2+-activated, permeabilized, single fibres (length approximately 2 mm; sarcomere length, 2.5 microm) from rabbit psoas muscle; [MgATP] was 4.6 mM, pH 7.1 and ionic strength was 200 mM. A small-amplitude (approximately 3 degrees C) rapid laser temperature-jump (0.2 ms T-jump) at 8-9 degrees C induced a tension rise to a new steady state and it consisted of two (fast and slow) exponential components. The T-jump-induced tension rise became slower as [MgADP] was increased, with half-maximal effect at 0.5 mM [MgADP]; the pre- and post-T-jump tension increased approximately 20% with 4 mM added [MgADP]. As determined by the tension change to small, rapid length steps (<1.4%L0 complete in <0.5 ms), the increase of force by [MgADP] was not associated with a concomitant increase of stiffness; the quick tension recovery after length steps (Huxley-Simmons phase 2) was slower with added MgADP. In steady-state experiments, the tension was larger at higher temperatures and the plot of tension versus reciprocal absolute temperature was sigmoidal, with a half-maximal tension at 10-12 degrees C; the relation with added 4 mM MgADP was shifted upwards on the tension axis and towards lower temperatures. The potentiation of tension with 4 mM added MgADP was 20-25% at low temperatures (approximately 5-10 degrees C), but approximately 10% at the physiological temperatures (approximately 30 degrees C). The shortening velocity was decreased with increased [MgADP] at low and high temperatures. The sigmoidal relation between tension and reciprocal temperature, and the basic effects of increased [MgADP] on endothermic force, can be qualitatively simulated using a five-step kinetic scheme for the crossbridge/A-MATPase cycle where the force generating conformational change occurs in a reversible step before the release of inorganic phosphate (P(i)), it is temperature sensitive (Q10 of approximately 4) and the release of MgADP occurs by a subsequent, slower, two-step mechanism. Modelling shows that the sigmoidal relation between force and reciprocal temperature arises from conversion of preforce-generating (A-M.ADP.P(i)) states to force-bearing (A-M.ADP) states as the temperature is raised. A tension response to a simulated T-jump consists of three (one fast and two slow) components, but, by combining the two slow components, they could be reduced to two; their relative amplitudes vary with temperature. The model can qualitatively simulate features of the tension responses induced by large-T-jumps from low starting temperatures, and those induced by small-T-jumps from different starting temperatures and, also, the interactive effects of P(i) and temperature on force in muscle fibres.


Figures

Figure 1
Figure 1. Tension transients induced by laser temperature jumps (T-jumps)
A, a fibre was maximally Ca2+-activated in control solution (no added MgADP) at 9°C and, during the steady tension plateau (pre-T-jump tension), a T-jump of ∼3°C was induced by a laser pulse (indicated by the arrow). The elevated temperature remained constant for at least ∼500 ms and decreased slowly afterwards (half-time of decrease >5 s; see Fig. 1 of Ranatunga, 1996). The T-jump induced a tension rise to a new steady level (post-T-jump tension) and the tension rise was fitted with a bi-exponential curve extracting two components, phase 2b and phase 3 (see Methods). B, an identical T-jump was induced when the same fibre was activated in the presence of 4 mm added MgADP. For easy comparison with the control, only the initial 500 ms of a 5 s sweep is shown; the tension reached at ∼500 ms was >99% of that at 700 ms when the temperature had decreased by ∼0.1°C. Note that compared with the control, the pre-T-jump tension is higher, but the T-jump-induced tension rise is slower in the presence of 4 mm MgADP, whereas the actual amplitude of the tension rise is similar.
Figure 2
Figure 2. Pre-T-jump and post-T-jump active tensions versus added [MgADP]
Pooled (means ± s.e.m.) tension data are shown for different [MgADP] from five fibres that were maximally Ca2+-activated at 8–9°C (^) and a T-jump induced; a full data set was obtained from each fibre. The new steady tension data at the elevated temperature of 11–12°C (post-T-jump) are shown by •. Tensions are given as ratios of the pre-T-jump tension of the first control (i.e. with no added MgADP) in each fibre. A hyperbolic curve was fitted to each pooled data set. Note that the active tension is increased by about 20% with 4 mm MgADP at both pre- and post-T-jump temperatures. The T-jump increased force by ∼6% per degree Celsius.
Figure 3
Figure 3. Analysed rate and amplitude data
The tension responses induced by standard T-jumps in control conditions (no added MgADP) and at a range of added [MgADP] were analysed by curve fitting as shown in Fig. 1. A, the mean (± s.e.m.) rate constants (reciprocal time constant) from five fibres are plotted against different [MgADP]. Filled symbols show data for endothermic force generation (phase 2b). A hyperbolic curve was fitted to the pooled individual data for phase 2b gives a maximum rate of 40 s−1, a minimum of 16 s−1 and half-maximal effect at 0.5 mm[MgADP]. Open symbols represent data for the slow phase 3, and show relative insensitivity (or slight decrease) to [MgADP]. B, the amplitudes of the two exponential components (fast phase 2b, filled symbols; slow phase 3, open symbols) are plotted against [MgADP]; the amplitudes of phase 2b and 3 show minimal sensitivity to [MgADP].
Figure 4
Figure 4. Sample records of tension responses to length steps
A, a fibre was activated to steady state in control solution and a length-release and a length-stretch step of the same amplitude (∼0.25%L0) was applied; the resultant tension responses are shown on the top panel. A length step was complete in <0.5 ms; the position of the first-order He–Ne laser diffraction for release only, shown in the middle panel (in arbitrary units), indicates sarcomere length shortening induced by the fibre-length release. Temperature 9°C. B, sample traces from an experiment on another fibre, activated in the presence of 4 mm added MgADP, where the length step amplitude was 0.9%L0. The diffractometer signals in the middle panel indicate sarcomere length changes, but the slow oscillations in them are probably artefacts. Note that the tension recovery is slower with MgADP. Temperature 10°C. In each tension response, the tension reaches a peak (T1) at the end of a length step and then quickly but partially recovers to a level referred to as T2 (Huxley & Simmons, 1971). The peak tension change (ΔT) due to a length step (ΔL) was measured as T1–T0 for stretch and T0–T1 for release (T0, steady tension before length step) and stiffness calculated as (ΔT/ΔL); in order to pool the data from different fibres, ΔL was normalized to L0 and ΔT normalized to control T0. The initial rapid tension recovery after length-step (Huxley–Simmons phase 2 or T1–T2 recovery; Huxley & Simmons, 1971) was characterized by fitting a bi-exponential curve isolating two components referred to as phase 2a (very fast) and phase 2b; a curve is drawn through each trace.
Figure 5
Figure 5. Pooled data from analysis of tension responses to length steps
A, data from three fibres in each of which the tension responses to 2–4 stretch and release steps of the same amplitude (0.3–1.3%L0, in different fibres) were examined under control conditions (open columns) and in the presence of added 4 mm MgADP (double hatched columns). The columns on the left show (MgADP/control) percentage tension ratios; tension in the presence of ADP is ∼20% higher. The columns on the right show the mean (± s.e.m., n = 8) stiffness from the fibres (see Fig. 4 legend), normalized to L0 and control T0 of each fibre; the slightly higher stiffness with ADP (178 ± 15.5 T0/L0) is not significantly different (paired t test, P > 0.05) from control stiffness (163 ± 17.8 T0/L0). Thus, the tension potentiation by MgADP is not associated with a corresponding increase of stiffness. B, pooled data for the reciprocal time constants of the two exponential components (phase 2a, squares; phase 2b, circles) isolated by curve fitting to the initial tension recovery after a length step; they are plotted on a logarithmic ordinate against the length step amplitude as percentage L0. Data are from five fibres in three of which data were obtained both in control (filled symbols) and with 4 mm added MgADP (open symbols); each fibre contributed data for release and stretch. The lines are the calculated regressions, significant (P < 0.05) only for the control data (continuous lines). Despite the scatter, the rates with added ADP are, on average, lower particularly with length releases.
Figure 6
Figure 6. Tension traces from a single fibre at different temperatures
Three pairs of tension traces from the same fibre show activations at 5, 10 and 20°C in control solution (lower trace in each panel) and with 4 mm added ADP (upper trace). The tension traces in each pair have been aligned so that the onset of activation is superimposed. Control steady tension is higher and the tension rise is faster at the higher temperatures. Tension in the presence of 4 mm added MgADP is greater compared with control at all temperatures; the potentiating effect of MgADP however, becomes less marked as temperature is increased. The horizontal time bar beneath the tension records is 2 s.
Figure 7
Figure 7. Active tension versus temperature relation
Pooled data from a total of 18 different fibres where tension was measured in control solution and with 4 mm added MgADP at one or more temperatures. At the end of the experiment, mean (± s.e.m.) control tension in these fibres was 0.96 (±0.01) of the initial control tension. A, active tensions measured in control (open symbols) and with added 4 mm MgADP (filled symbols) solutions are plotted as mean (± s.e.m.) specific tension (in kN m−2) against reciprocal absolute temperature (as 103 K/T), also labelled in degrees Celsius. The sigmoidal curve fitted to the control data corresponds to half-maximal tension at ∼12°C, but the curve is shifted to a slightly lower temperature with MgADP; half-maximal tension from the curve occurs at ∼10°C. The tension with 4 mm MgADP was significantly greater (P < 0.01) than the controls at 5, 10 and 20°C. B, the data shown in A were normalized, so that tension measured in solutions containing 4 mm MgADP is shown as a ratio of control tension (indicated by the horizontal dashed line) in each fibre and plotted against reciprocal absolute temperature. Data were obtained from 4 different fibres at 5°C, 13 fibres at 10°C, 8 fibres at 20°C and 3 fibres at 30°C. Note that, although there was considerable variability in the ratio, the MgADP/control tension ratio obtained at 5°C is significantly greater than the ratios at 20 and 30°C.
Figure 8
Figure 8. Effect of [MgADP] on shortening velocity and rate of tension redevelopment at different temperatures
A, superimposed tension records (upper panel) from a maximally activated single fibre in solutions containing 0, 0.5, 1, 2 and 4 mm added MgADP at 10°C. The initial part of the traces shows that isometric tension is higher with higher [MgADP] and, following a length release (amplitude 14%L0) is a slack period and tension redevelopment. For clarity, only a single length record is shown in the lower panel. Note that the slack period (duration of unloaded shortening) increases with increasing [MgADP] and the force redevelopment becomes slower. Length step amplitude/duration of unloaded shortening was taken as shortening velocity. B, data from 4 different fibres (two of which were tested at two different temperatures) are shown where shortening velocity (as L0 s−1) is plotted against added [MgADP] for 30°C (stars), 20°C (triangles), 10°C (filled circles, representing fibre shown in A) and 5°C (diamonds). C, data for rate of tension redevelopment (reciprocal half-time for tension rise) from experiments at 20, 10 and 5°C from the same fibres presented in B. For clarity, the data obtained at 30°C are not shown as the data points were overlaying data at 20°C. Note that the shortening velocity and the rate of tension rise in control conditions (plotted at zero [MgADP]) are markedly increased at the higher temperatures, as found in intact rat muscle experiments (Ranatunga, 1984).
Figure 9
Figure 9. General model characteristics
A, Arrhenius plots of the two rate constants of the model (see Scheme 1) that were increased to simulate temperature effects. The rate of the force generation step (k+1) increased markedly (see Zhao & Kawai, 1994; Q10∼4) and that of ADP-release step (k+4) slightly (Q10 of 1.3). The symbols show values for a selected number of temperatures. Note that the marked temperature sensitivity of k+1 implies that it would not be very much slower than inorganic phosphate (Pi) release (see Methods) at high temperatures. B, the fractional occupancy of the five states under control conditions (low [MgADP]∼10 μm and 0.5 mm Pi) calculated for a selected number of temperatures, and plotted against reciprocal absolute temperature. Open symbols show states (V and I) that do not contribute to force (○, AM + M.ATP + M.ADP.Pi that are not separately identified in the model; and □, AM.ADP.Pi, the pre-force-generating state). Note the dominance of pre-force-generating state (AM.ADP.Pi) at the low temperatures (e.g. ∼10°C), and the decrease of its occupancy with warming. Filled symbols represent force-bearing states (⋄, AM*.ADP.Pi; •, AM*.ADP; and ▪, AM*′.ADP); note the increased occupancy of AM.ADP (post-power stroke) states as the temperature is raised. For any temperature, the sum of the occupancies of the five states is 1. C, filled circles show simulated, steady-state (at 1–2 s) tension (as the sum of the fractional occupancies of states II, III and IV) under control conditions (0.5 mm Pi and 10 μm ADP) at 5°C intervals. Note the approximate sigmoidal relation with half-maximal at ∼10–12°C, as found experimentally; force at 0°C is ∼20%. If force is determined at short intervals after large T-jumps to a high temperature, the apparent saturation of force at high temperature is reduced (crosses and dotted line). Open diamonds with dashed curve show that with simulated 4 mm[MgADP] (k−4 set to a higher value), the sigmoidal relation is shifted to the right (compare with Fig. 7A).
Figure 10
Figure 10. Simulated tension transients to a standard T-jump
A, superimposed tension transients induced by a ∼3°C standard T-jump at a starting temperature of ∼9°C, in control activation (continuous curve) and in the presence of 4 mm MgADP (dashed curve). A T-jump was simulated by re-setting k+1 and k+4 to higher values (Q10 values of 4 and 1.3, respectively) and [MgADP] changed by altering k−4: change with time of the sum of the fractional occupancies of states II, III and IV (see Scheme 1) represent the tension rise. The tension records have been shifted vertically for superimposition. Note that the tension rise is slower but amplitudes are similar with added MgADP, as found experimentally (see Fig. 1). B, the pre-T-jump (crosses) and the post-T-jump (circles) tensions calculated for a number of [MgADP] levels (on a logarithmic abscissa) are shown by the symbols; they are normalized to the pre-T-jump control (dashed line). Note the qualitative resemblance to the experimental data shown in Fig. 2. C, since previous simulations of Pi effects did not use a model having MgADP release steps, simulated T-jump-induced tension transients in control (continuous curve) and in the presence of 30 mm Pi (dashed curve) from the present model are shown; [Pi] is changed by altering k−2. Note that tension rise is faster with increased Pi (as previously reported: Davis & Rogers, 1995; Ranatunga, 1999a). D, [Pi] dependence of pre- and post-T-jump tensions from simulations – the presentation is similar to B; the half-maximal effect is at 5–10 mm[Pi].
Figure 11
Figure 11. Simulated tension responses to different T-jumps
T-jumps were simulated under control conditions and the tension rise determined basically as in Fig. 10 (i.e. change with time of the sum of the fractional occupancies of states II, III and IV in Scheme 1 represents the tension rise). A, T-jumps of different amplitudes (as labelled), increasing up to 35°C, were modelled from the same starting temperature of 0°C; both the amplitude and the rate of the T-jump-induced tension rise increase with increase of post-T-jump temperature. Note the qualitative similarity of the transients to those in the experiments of Bershitsky & Tsaturyan (2002) who used large T-jumps from low starting temperatures. The modelled tension responses at high temperatures (e.g. 30 and 35°C), however, showed that the tension decreases slowly after the initial rapid rise so that, if tension is measured at 50–100 ms after large T-jumps, the tension versus temperature relation may not be sigmoidal, nor would it show saturation at high temperatures (see Fig. 9C). B, T-jumps of constant amplitude (5°C) from different starting temperatures of 0–30°C (post-T-jump temperature is labelled); the system was allowed to reach steady state at each temperature before a T-jump was simulated. The rate of rise of the simulated tension response increases with (pre- or post-T-jump) temperature, but its amplitude initially increases and then decreases as the starting temperature is increased (>15°C); since the pre-T-jump tension (the tension at zero time for each trace) increases with warming, the tension amplitude per 5°C T-jump decreases with increase of starting temperature (see Goldman et al. 1987). Note the qualitative similarity of these simulated tension responses to the experimental responses of Coupland et al. (2001) where the traces in Fig. 1A were obtained by adopting a similar methodology.
Figure 12
Figure 12. Tension components from simulated T-jumps (under control conditions)
The tension rise induced by T-jumps, as shown in Fig. 11, consisted of three exponential components (see Methods), one fast and two slow, but could be reduced to two by combining the two slow components whose rates were similar; these were available directly from the matrix method used in the simulations (see Gutfreund & Ranatunga, 1999). Their rates and amplitudes (fractional occupancy) were calculated for 5°C intervals and are plotted against reciprocal post-T-jump temperature. A, the rate of the fast component (filled symbols) increases markedly with temperature; the rates of the two slow components, which had similar values (<10 s−1), were averaged and the average slow rate (open symbols) shows only a modest increase with temperature. B, with simulated large T-jumps, the amplitude of the fast component (filled circles) increases sharply with temperature. The sum of the amplitudes of the two slow components (open circles) is prominent at temperatures <25°C, but decreases at higher temperatures (indeed it becomes negative and contributes to a slow tension decline after T-jump to 30–35°C). C, it should be clear that with small T-jumps (∼5°C) from different starting temperatures (as in Fig. 11B, and in the experimental studies of Goldman et al. 1987; Davis & Rodgers, 1995; Ranatunga, 1996), the rate constant data in A are identical, but the absolute fractional amplitudes would be small. The filled circles (fast) and the open circles (combined slow) show the amplitude data from simulation of such an experiment. In general, the data show that a T-jump-induced tension rise would contain two components, but the biphasic nature of the tension rise would be less clear when large T-jumps from low starting temperatures are examined because of the rapid growth with increased temperature of the fast component. Also, note that the sum of the amplitudes (T-jump-induced change in the fractional occupancies of the three force-bearing states) plus their sum at the pre-T-jump temperature gives the steady force at a given temperature and, hence, the sigmoidal force versus reciprocal temperature relation as shown by the filled symbols in Fig. 9C.

Similar articles

Cited by

References

    1. Bershitsky SY, Tsaturyan AK. Effect of joule temperature jump on tension and stiffness of skinned rabbit muscle fibers. Biophys J. 1989;56:809–816. - PMC - PubMed
    1. Bershitsky SY, Tsaturyan AK. Tension responses to Joule temperature jump in skinned rabbit muscle fibres. J Physiol. 1992;447:425–448. - PMC - PubMed
    1. Bershitsky SY, Tsaturyan AK. Force generation and work production by covalently cross-linked actin–myosin cross-bridges in rabbit fibers. Biophys J. 1995;69:1011–1021. - PMC - PubMed
    1. Bershitsky SY, Tsaturyan AK. The elementary force generation process probed by temperature and length perturbations in muscle fibres from rabbit. J Physiol. 2002;540:971–988. - PMC - PubMed
    1. Bershitsky SY, Tsaturyan AK, Bershitskaya ON, Mashanov P, Brown P, Burns B, Ferenczi MA. Muscle force is generated by myosin heads stereo-specifically attached to actin. Nature. 1997;388:186–190. - PubMed

Publication types

Substances