. 2005 Sep 1;567(Pt 2):427-43.
doi: 10.1113/jphysiol.2005.087130. Epub 2005 Jun 23.

Cell shrinkage as a signal to apoptosis in NIH 3T3 fibroblasts

Affiliations

Cell shrinkage as a signal to apoptosis in NIH 3T3 fibroblasts

Martin B Friis et al. J Physiol. .

Abstract

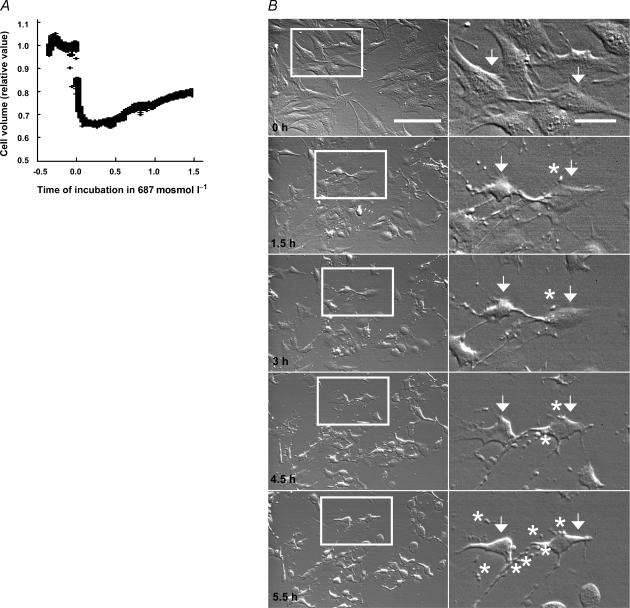
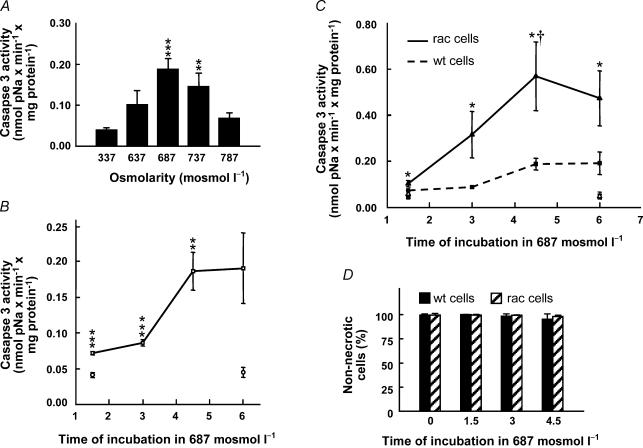
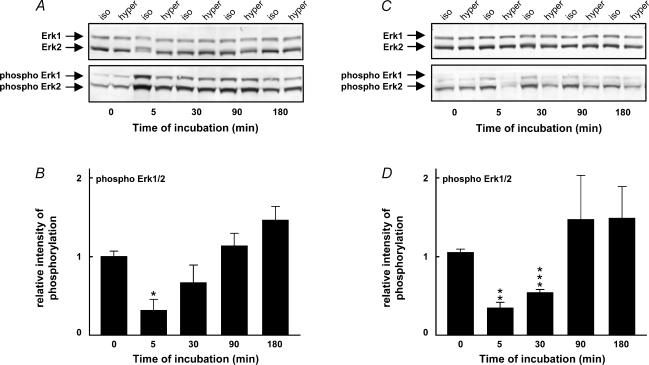
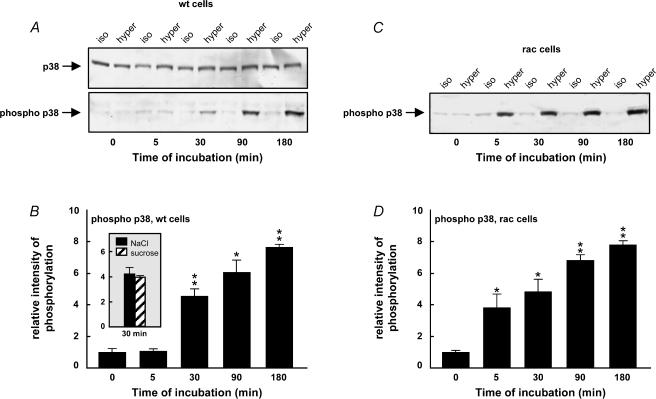
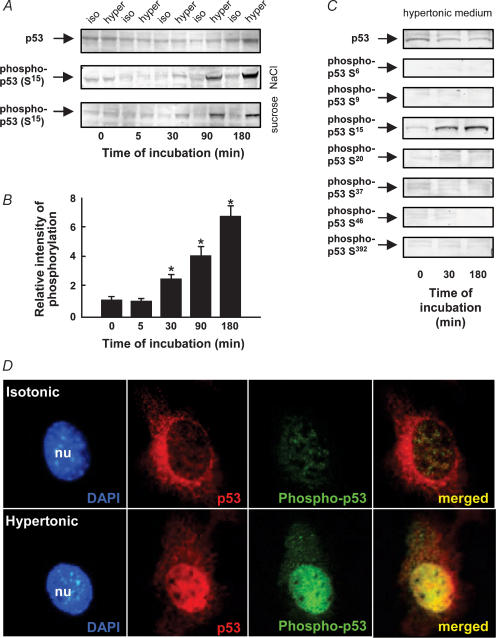
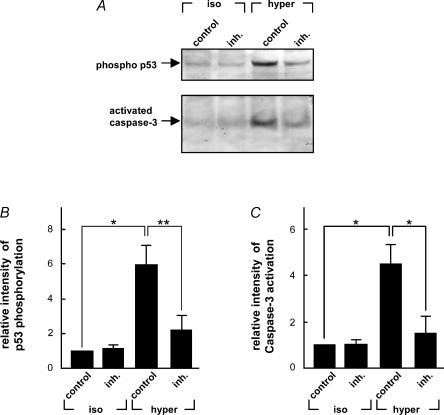
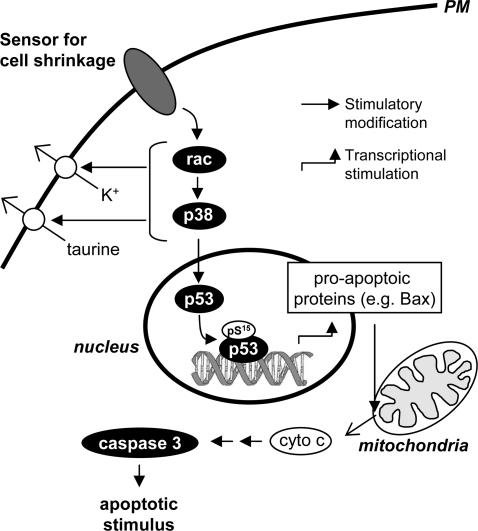
Cell shrinkage is a hallmark of the apoptotic mode of programmed cell death, but it is as yet unclear whether a reduction in cell volume is a primary activation signal of apoptosis. Here we studied the effect of an acute elevation of osmolarity (NaCl or sucrose additions, final osmolarity 687 mosmol l(-1)) on NIH 3T3 fibroblasts to identify components involved in the signal transduction from shrinkage to apoptosis. After 1.5 h the activity of caspase-3 started to increase followed after 3 h by the appearance of many apoptotic-like bodies. The caspase-3 activity increase was greatly enhanced in cells expressing a constitutively active G protein, Rac (RacV12A3 cell), indicating that Rac acts upstream to caspase-3 activation. The stress-activated protein kinase, p38, was significantly activated by phosphorylation within 30 min after induction of osmotic shrinkage, the phosphorylation being accelerated in fibroblasts overexpressing Rac. Conversely, the activation of the extracellular signal-regulated kinase (Erk1/2) was initially significantly decreased. Subsequent to activation of p38, p53 was activated through serine-15 phosphorylation, and active p53 was translocated from the cytosol to the nucleus. Inhibition of p38 in Rac cells reduced the activation of both p53 and caspase-3. After 60 min in hypertonic medium the rate constants for K+ and taurine efflux were increased, particular in Rac cells. We suggest the following sequence of events in the cell shrinkage-induced apoptotic response: cellular shrinkage activates Rac, with activation of p38, followed by phosphorylation and nuclear translocation of p53, resulting in permeability increases and caspase-3 activation.


Figures

Figure 1
Figure 1. Regulatory volume increase and morphological changes after hypertonic (high NaCl) cell shrinkage
A, cell volume changes in wild-type NIH 3T3 cells as a function of time after hypertonic exposure. Relative cell volume was monitored in adherent NIH 3T3 cells using large angle light scattering. A hypertonic challenge was induced at time zero, by changing the isotonic Ringer perfusion solution to a hypertonic (high NaCl) Ringer solution (687 mosmol l−1). The experiment is representative of six independent experiments lasting up to 30 min and three independent experiments lasting more that 1 h. The mean volume recovery at 30 min was 29 ± 14% (n = 6). B, morphology of cells treated with high salt (687 mosmol l−1) added to the DMEM for 0, 1.5, 3, 4.5 and 5.5 h. Scale bar: 100 μm (left row images). The right row of images shows two cells from the left row marked with arrows; notice the cell shrinkage seen at 1.5 h after addition of hypertonic solution. Apoptotic-like cytoplasmatic bodies (marked with asterisks) surrounding the cells were notable after 4.5 and 5.5 h in hypertonic solution. Scale bar: 25 μm.
Figure 2
Figure 2. Caspase-3 activity as a function of increasing osmolarity and incubation time in NIH 3T3 cells and RacV12A3 cells
A, cells were incubated in either isotonic (337 mosmol l−1) or hypertonic (high NaCl) DMEM (637, 687 or 787 mosmol l−1) for 4.5 h. The number (n) of independent experiments was ≥ 3. B, cells were incubated at either 337 mosmol l−1 (○) or 687 mosmol l−1 (□) for 1.5, 3, 4.5 and 6 h. The number (n) of independent experiments was ≥ 3. C, cells were incubated in either isotonic (337 mosmol l−1) or hypertonic (687 mosmol l−1) DMEM for 1.5, 3, 4.5 and 6 h. Symbols: □, isotonic NIH 3T3 cells; ▵, isotonic RacV12A3 cells; ▪, hypertonic NIH 3T3 cells; ▴, hypertonic RacV12A3 cells. The number of independent experiments was ≥ 4.The cells were in all cases lysed, and cell lysate was incubated with the colorimetric caspase-3 substrate, Ac-DEVD-pNA, and quantified at 405 nm. The error bars indicate standard error of the mean. *P < 0.05, **P < 0.01, ***P < 0.001, significantly different from the isotonic control. †P < 0.05, significantly different from the wt cells at the same time point. D, test for necrosis. NIH 3T3 cells (wt) or RacV12A3 cells (rac) were incubated in either isotonic (337 mosmol l−1) DMEM or in hypertonic (high NaCl) DMEM (687 mosmol l−1) for 1.5, 3 and 4.5 h. The number of cells with an intact membrane (cells that are not necrotic) was evaluated using propidium iodide staining. The number (n) of independent experiments was 2 for wt and 3 for rac cells.
Figure 3
Figure 3. Level of Erk1/2 phosphorylation in hypertonic medium
A, NIH 3T3 cells were incubated in either isotonic (337 mosmol l−1) or hypertonic (high NaCl) DMEM (687 mosmol l−1), and cell lysates were subjected to SDS-PAGE and Western blot analysis at various time intervals. Specific antibodies against Erk1/2 (rabbit anti-Erk1/2) and phospho-Erk1/2 (rabbit antiphospho-Erk1/2) were used. B, intensity of Erk1/2 (p42) phosphorylation in hypertonic medium relative to the isotonic control. *P < 0.05, **P < 0.01, ***P < 0.001, significantly different from the isotonic control. The number of independent experiments was ≥ 5. C and D, NIH3T3 cells were incubated in isotonic (337 mosmol l−1) DMEM and at time 0, concentrated NaCl or a similar amount of vehicle was added to the cells. The number of independent experiments was 3.
Figure 4
Figure 4. Level of p38 MAPK phosphorylation in hypertonic medium in wild-type NIH3T3 cells and in RacV12A3 cells
A, NIH 3T3 cells were incubated in either isotonic (337 mosmol l−1) or hypertonic (high NaCl) medium (687 mosmol l−1), and cell lysates were subjected to SDS-PAGE and Western blot analysis at various time intervals. Specific antibodies against p38 (rabbit anti-p38) and phospho-p38 (rabbit anti-phospho-p38) were used. B, intensity of p38 MAPK phosphorylation in hypertonic NaCl medium relative to the isotonic control. The inset compares intensity of p38 MAPK phosphorylation after 30 min in hypertonic (high NaCl) medium and hypertonic (sucrose) medium (687 mosmol l−1). Experiments in C and D are identical to the experiments in A and B but using cells expressing constitutively active Rac. The number of independent experiments was ≥ 5. The error bars indicate standard error. *P < 0.05, **P < 0.01, significantly different from the isotonic control.
Figure 5
Figure 5. Level of p53 phosphorylation and subcellular localization of p53 and phospho-p53 in hypertonic medium
A, NIH 3T3 cells were incubated in either isotonic (337 mosmol l−1), hypertonic (high NaCl) medium (687 mosmol l−1) or hypertonic (sucrose) medium (687 mosmol l−1), and cell lysates were subjected to SDS-PAGE and Western blot analysis at various time intervals. Specific antibodies against p53 (mouse anti-p53) and phospho-p53 (rabbit anti-phospho-p53 S15) were used. B, intensity of p53 phosphorylation in hypertonic (high NaCl) medium relative to the isotonic control. The error bars indicate standard error. *P < 0.05, significantly different from the isotonic control. The number of independent experiments was 5 except for the sucrose experiment where n = 2. C, SDS-PAGE and Western blot analysis of p53 phosphorylation at serine in positions 6, 9, 15, 20, 37, 46 and 392 after 0, 30 and 180 min of incubation of cells in high salt medium (687 mosmol l−1). D, subcellular localization of p53 and phospho-p53. Immunolocalization of rabbit anti-p53 (red) and mouse anti-phospho-p53 S15 (green) in NIH 3T3 cells 30 min after incubation in either isotonic (337 mosmol l−1) or hypertonic (687 mosmol l−1) medium. Nuclei, stained with 4′,6-diamidino-2-phenylindole (DAPI), appear blue. Typical of 3 independent experiments.
Figure 6
Figure 6. Level of p53 phosphorylation and caspase-3 activation in the presence of p38 inhibitor in hypertonic medium
A, RacV12A3 cells were preincubated for 1 h in isotonic (337 mosmol l−1) medium and 10 μm SB203580 followed by 4.5 h incubation in hypertonic medium (687 mosmol l−1). Cell lysates were prepared and subjected to SDS-PAGE and Western blot analysis. Specific antibodies against phospho-p53 (rabbit antiphospho-p53 S15) and cleaved caspase-3 (rabbit anticleaved caspase-3) were used. B, intensity of phospho-p53 S15 in isotonic medium containing SB203580 and hypertonic medium with and without SB203580 relative to isotonic control (n = 3). C, intensity of cleaved caspase-3 in isotonic medium containing SB203580 and hypertonic medium with and without SB203580 relative to the isotonic control (n = 3). *P < 0.05, **P < 0.01, significantly different from the isotonic control.
Figure 7
Figure 7. Effect of exposure to hypertonic NaCl on the rate constant for taurine and K+ efflux in wild-type NIH 3T3 cells and in RacV12A3 cells
Cells grown at 80% confluence were loaded with [3H]taurine and 86Rb+ for 2 h and subsequently exposed to hypertonic DMEM (687 mosmol l−1) in the time period indicated on the abscissa. [3H]Taurine and 86Rb+ release from the cells was followed at 2 min intervals in a 10-min period, and the rate constants (min−1) for the 86Rb+ loss (A) and for the [3H]taurine loss (B) were estimated from the cellular fraction lost to the extracellular compartment during the efflux experiment. Values are given as means ± s.e.m. for n = 3 (A), n = 3 (B) and n = 3 (C and D) independent sets of experiments. *P < 0.05, **P < 0.01, significantly different from the isotonic control.
Figure 8
Figure 8. Proposed sequence of signal events in the cell shrinkage-induced Caspase3 activation
Cellular shrinkage detected by an unknown volume sensor activates Rac and p38, followed by permeability increases to K+ and taurine and phosphorylation and nuclear translocation of p53, resulting in caspase-3 activation. Black boxes indicate experimental evidence; white boxes indicate the action of possible, transitional signal events.

Similar articles

Cited by

References

    1. Anbari K, Schultz RM. Effect of sodium and betaine in culture media on development and relative rates of protein synthesis in preimplantation mouse embryos in vitro. Mol Reprod Dev. 1993;35:24–28. - PubMed
    1. Aznar S, Fernandez-Valeron P, Espina C, Lacal JC. Rho GTPases: potential candidates for anticancer therapy. Cancer Lett. 2004;206:181–191. - PubMed
    1. Bargonetti J, Manfredi JJ. Multiple roles of the tumor suppressor p53. Current Opinion Oncol. 2002;14:86–91. - PubMed
    1. Beisner KH. August Krogh Institute, University of Copenhagen; 2004. Volume regulation in NIH-3T3 fibroblasts: Effect of constitutively active RhoA, Rac1 and H-Ras. Masters Thesis.
    1. Best L, Sheader EA, Brown PD. A volume-activated anion conductance in insulin-secreting cells. Pflugers Arch. 1996;431:363–370. - PubMed

Publication types