. 2005 Jun 22;25(25):5926-34.
doi: 10.1523/JNEUROSCI.1360-05.2005.

The role of thalamic inputs in surround receptive fields of barrel neurons

Affiliations

The role of thalamic inputs in surround receptive fields of barrel neurons

Ernest E Kwegyir-Afful et al. J Neurosci. .

Abstract

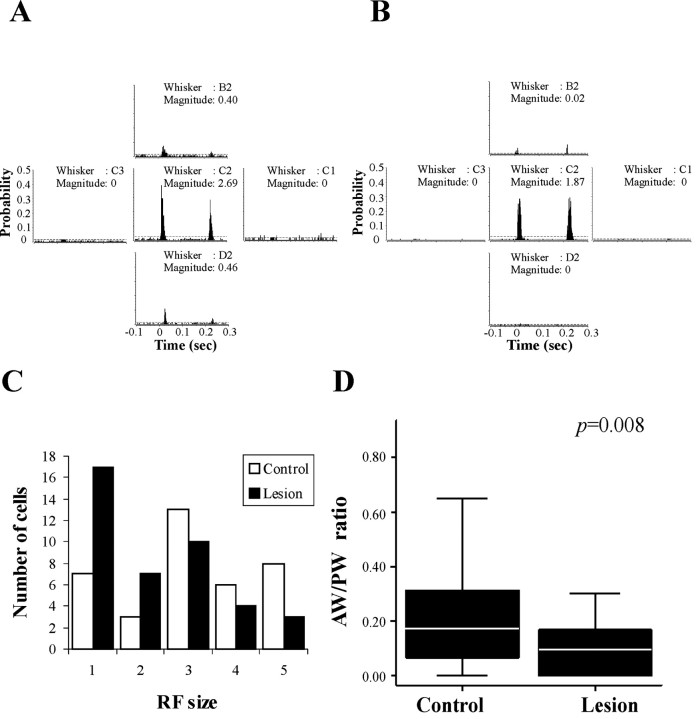
Controversy exists regarding the relative roles of thalamic versus intracortical inputs in shaping the response properties of cortical neurons. In the whisker-barrel system, this controversy centers on the mechanisms determining the receptive fields of layer IV (barrel) neurons. Whereas principal whisker-evoked responses are determined by thalamic inputs, the mechanisms responsible for adjacent whisker (AW) responses are in dispute. Here, we took advantage of the fact that lesions of the spinal trigeminal nucleus interpolaris (SpVi) significantly reduce the receptive field size of neurons in the ventroposterior thalamus. We reasoned that if AW responses are established by these thalamic inputs, brainstem lesions would significantly reduce the receptive field sizes of barrel neurons. We obtained extracellular single unit recordings from barrel neurons in response to whisker deflections from control rats and from rats that sustained SpVi lesions. After SpVi lesions, the receptive field of both excitatory and inhibitory barrel neurons decreased significantly in size, whereas offset/onset response ratios increased. Response magnitude decreased only for inhibitory neurons. All of these findings are consistent with the hypothesis that AW responses are determined primarily by direct thalamic inputs and not by intracortical interactions.


Figures

Figure 1.
Figure 1.
A photomicrograph of a Nissl-stained horizontal section through the brainstem showing a lesion in SpVi (A) and a cytochrome oxidase-stained section showing a midline lesion (B). Asterisks mark lesion sites. V, Trigeminal tract.
Figure 2.
Figure 2.
Representative PSTHs showing responses of a control VPM neuron (A) and a VPM neuron from an animal that sustained a brainstem lesion (B) to deflection of the principal whisker (center) and four adjacent whiskers. The horizontal dotted line represents the 99% confidence interval. Stimulus onset is at t = 0, and stimulus offset at t = 200 ms. The cell depicted in A had a receptive field size of five, whereas that in B was two. C, A histogram showing the distribution of receptive field (RF) sizes of VPM neurons in control animals and in animals that sustained a brainstem lesion. The distribution shifts to smaller receptive field sizes after the lesion. D, Boxplots showing the distribution of AW/PW response magnitude ratios of VPM neurons in control animals and in animals with brainstem lesions (Lesion). There is a significant (p = 0.03; Mann-Whitney U test) reduction in AW/PW ratios after the lesions. “Whiskers” on boxplots represent data that lay within 1.5 times the interquartile range from the first quartile to the third quartile.
Figure 3.
Figure 3.
Representative PSTHs showing responses of a control RSU (A) and an RSU from an animal that sustained a brainstem lesion (B) to deflection of the principal whisker (center) and four adjacent whiskers. The cell depicted in A had a receptive field size of three, whereas that in B was two. C, The distribution of receptive field (RF) sizes of RSUs shifts to smaller numbers after the lesion. D, Boxplots showing the distribution of AW/PW response magnitude ratios of RSUs in control animals and animals with brainstem lesions. There is a significant (p = 0.008; Mann-Whitney U test) reduction in AW/PW ratios after the lesions. “Whiskers” are as described in the legend to Figure 2.
Figure 4.
Figure 4.
Representative PSTHs showing responses of a control FSU (A) and an FSU from an animal that sustained a brainstem lesion (B) to deflection of the principal whisker (center) and four adjacent whiskers. Conventions are identical to those in Figure 2. The cell depicted in A had a receptive field size of five, whereas that in B was three. C, The distribution of receptive field (RF) sizes of FSUs shifts to smaller numbers after brainstem lesion. D, Boxplots showing the distribution of AW/PW response magnitude ratios of FSUs in control animals and animals with brainstem lesions. There is a significant (p = 0.001; Mann-Whitney U test) reduction in AW/PW ratios after brainstem lesions. “Whiskers” are as described in the legend to Figure 2.
Figure 5.
Figure 5.
A, Boxplots showing the distribution of response magnitude of RSUs, FSUs, and VPM neurons in control and in animals with lesions. Brainstem lesions resulted in a significant decrease in the response magnitude of FSUs but not of RSUs or VPM neurons. B, The OFF/ON ratios of RSUs increased significantly after the lesions. There was a similar increase in OFF/ON ratios of FSUs after brainstem lesions. In contrast, the increase in OFF/ON ratios of VPM neurons was not statistically significant. “Whiskers” are as described in the legend to Figure 2. C, Population PSTHs showing the response of RSUs (top row) and FSUs (bottom row) to PW and AW deflection in control animals and animals that sustained brainstem lesions (Lesion). The number of neurons (n) used to construct each PSTH is indicated. The horizontal line represents the 99% confidence interval.
Figure 6.
Figure 6.
PSTHs of responses of a poorly tuned (category 0; A) and a well tuned (category 5; B) neuron to deflection of a single whisker in eight different directions. Polar plots (below the histograms) were constructed by plotting the normalized response magnitude against the direction of whisker deflection. 0° represents deflection in the caudal direction, and 90° is deflection in the dorsal direction. The horizontal dotted line represents the 99% confidence interval. Stimulus onset is at t = 0, and stimulus offset at t = 200 ms. deg, Degrees. C, A histogram showing the distribution of angular selectivity of control RSU and RSUs obtained from animals with brainstem lesions (Lesion).

References

    1. Armstrong-James M (1995) The nature and plasticity of sensory processing within adult rat barrel cortex. In: Cerebral cortex, Vol 11, The barrel cortex of rodents (Jones EG, Diamond IT, eds), pp 333-373. New York: Plenum.
    1. Armstrong-James M, Callahan CA (1991) Thalamo-cortical processing of vibrissal information in the rat. II. Spatiotemporal convergence in the thalamic ventroposterior medial nucleus (VPm) and its relevance to generation of receptive fields of S1 cortical “barrel” neurones. J Comp Neurol 303: 211-224. - PubMed
    1. Armstrong-James M, Fox K (1987) Spatiotemporal convergence and divergence in the rat SI barrel cortex. J Comp Neurol 263: 265-281. - PubMed
    1. Armstrong-James M, Callahan CA, Friedman MA (1991) Thalamo-cortical processing of vibrissal information in the rat. I. Intracortical origins of surround but not centre-receptive fields of layer IV neurones in the rat S1 barrel field cortex. J Comp Neurol 303: 193-210. - PubMed
    1. Arnold PB, Li CX, Waters RS (2001) Thalamocortical arbors extend beyond single cortical barrels: an in vivo intracellular tracing study in rat. Exp Brain Res 136: 152-168. - PubMed

Publication types

LinkOut - more resources