. 2005 Jun 24;308(5730):1931-4.
doi: 10.1126/science.1109886.

Elementary response of olfactory receptor neurons to odorants

Affiliations

Elementary response of olfactory receptor neurons to odorants

Vikas Bhandawat et al. Science. .

Abstract

Signaling by heterotrimeric GTP-binding proteins (G proteins) drives numerous cellular processes. The number of G protein molecules activated by a single membrane receptor is a determinant of signal amplification, although in most cases this parameter remains unknown. In retinal rod photoreceptors, a long-lived photoisomerized rhodopsin molecule activates many G protein molecules (transducins), yielding substantial amplification and a large elementary (single-photon) response, before rhodopsin activity is terminated. Here we report that the elementary response in olfactory transduction is extremely small. A ligand-bound odorant receptor has a low probability of activating even one G protein molecule because the odorant dwell-time is very brief. Thus, signal amplification in olfactory transduction appears fundamentally different from that of phototransduction.


Figures
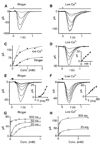
Fig. 1
Fig. 1
Odorant-induced responses of an isolated frog ORN in normal and low (20 µM)–Ca2+ Ringer solutions. (A to C) Comparison of responses from the same cell in normal and low-Ca2+ Ringer solutions. (A) Normal Ringer solution. Responses to a 25-ms pulse of cineole at 300, 500, 1000, and 2000 µM, respectively. Each trace represents the average of two to five stimulus trials (five for each of the two smallest responses). (B) Low-Ca2+ Ringer solution. Responses to a 25-ms pulse of cineole at 50, 100, 300, 500, 1000, and 1500 µM, respectively. Each trace represents the average of two to five trials. (C) The dependence of the transient peak current on odorant concentration in (A) and (B) are plotted for comparison. The smooth curve for normal Ringer solution is a least-squares fit of the Hill equation, I = ImaxCn/(Cn + K1/2n), where I is current response, Imax is maximum current, C is odorant concentration, K1/2 is the concentration required to elicit half the maximum response, and n is the Hill coefficient. The curve is fit with Imax = 82 pA, K1/2 = 625 µM, n = 2.8. The smooth curve in low-Ca2+ Ringer solution is fit with Imax = 217 pA, K1/2 = 329 µM, n = 1. The dashed line indicates that the foot of the dose-response relation is linear. (D) Responses of a different cell in low-Ca2+ Ringer solution to a 25-ms pulse of cineole at 100, 300, 500, 750, and 1000 µM, respectively. Each trace represents the average of five stimulus trials. (Inset) Linear dose-response relation. (E) Responses of a different cell in normal Ringer solution to a 200 µM cineole pulse of different durations (25, 35, 45, 55, 65, and 75 ms, respectively). Each trace represents the average of 10 stimulus trials. (Inset) Least-squares fit of the equation ICn (n = 2.8). (F) Responses of a different cell in low-Ca2+ Ringer solution to a 100 µM cineole pulse of different durations (25, 35, 45, 55, 65, and 75 ms, respectively). Each trace represents the average of 6 to 10 stimulus trials. (Inset) A linear-regression fit has a time intercept of −2 ms. Results similar to those in Fig. 1, B, D, and F, were obtained upon “ clamping” the internal Ca2+ concentration during the olfactory response by replacing external Na+ in the low-Ca2+ solution with the permeant guanidinium ion to simultaneously stop Ca2+ influx through the CNG channel and Ca2+ efflux through the Na-Ca exchanger (11, 24). (G and H) Strong dependence of K1/2 of the dose-response relation on the duration of stimulation by odorant. Each panel represents responses from a different cell. Each point is the average of 2, 5 or 10 stimulus trials. (G) Normal Ringer solution. Relation between response amplitude and odorant concentration with stimulus durations of 25, 50, and 500 ms, respectively. The smooth curves are Hill-equation fits with Imax, K1/2, and n of 75 pA, 1.5 µM, and 0.8 (500 ms); 61 pA, 99 µM, and 1.5 (50 ms); and 46 pA, 238 µM, and 2.3 (25 ms), respectively. Thus, by increasing the odorant duration from 25 to 500 ms, the K1/2 decreases from 238 to 1 µM. (H) Low-Ca2+ Ringer solution. Dose-response relations from a different cell with 25- and 300-ms odorant duration, respectively. Smooth curves are Michaelis-equation (i.e., Hill equation with n = 1) fits, with Imax and K1/2 of 121 pA and 24 µM (300 ms) and 45 pA and 128 µM (25 ms), respectively.
Fig. 2
Fig. 2
Quantal analysis of the olfactory response in 100 nM Ca2+ Ringer solution to a series of 190 identical weak pulses of cineole (50 ms, 50 µM). (A) Sample traces showing trial-to-trial fluctuations in the response amplitude. The red traces are scaled fits of a mathematical function (12) that describes the averaged response. (B). Amplitude histogram for 190 trials. Bin-width is 0.2 pA. (Inset) Ensemble mean and variance as a function of time. Downward spike in the mean response indicates junction current introduced to mark the timing and duration of odorant stimulation (12). At the response peak, the mean current was 2.9 pA and the variance was 2.6 pA2. These values give a unitary response of 0.9 pA and a mean quantal content (λ) of 3.2. The solid red curve is the Poisson distribution (12) with λ = 3.2, scaled by a unitary amplitude of 0.9 pA and blurred by Gaussian functions with σ0 = 0.27 pA, σ1 = 0.33 pA (12). The dashed profiles are Gaussians corresponding to failures and populations with quantal content of 1, 2, etc. (C) Results from 19 cells on the unitary amplitude in 100 nM Ca2+, derived from σ2/m. The values were all very similar and independent of m. Filled triangle and error bars: mean ± SD.
Fig. 3
Fig. 3
Variance analysis of the olfactory response in Ringer solution containing 20 µM Ca2+. (A to C) A series of 78 identical pulses of cineole (25 ms, 300 µM) was delivered to an ORN. (A) Eight sample traces showing trial-to-trial fluctuations in the response amplitude. The red traces are scaled fits of a mathematical function that describes the averaged response. Downward spike in each trace indicates junction current introduced to mark the timing and duration of odorant stimulation (12). (B) (Left) Ensemble variance and mean as a function of time from 78 trials. The downward deflection in the “mean” trace was the junction current. The variance (σ2) and (mean)2 time courses overlap throughout. (C) The amplitude histogram was well described by the Poisson distribution calculated from the σ2/m analysis (mean number of quanta = 4.0, quantal amplitude = 0.42 pA). (D) Variance/mean analysis of olfactory response from a different cell in four stimulus conditions, each with 20 identical cineole pulses. The value of σ2/m is approximately constant at different m values. The Ringer solution contained guanidinium with a low concentration of Ca2+. (E) Results of σ2/m measurements, with cineole (27 cells), isoamylacetate (7 cells), or acetophenone (6 cells) as odorant. Black open squares show measurements in low-Ca2+ sodium Ringer solution. Red open circles show measurements in low-Ca2+ guanidinium Ringer solution. Corresponding filled symbols show mean ± SD (black: 0.40 ± 0.06 pA, 18 cells; red: 0.17 ± 0.07 pA, 22 cells). The smaller unitary response in guanidinium/low-Ca2+ solution reflects a smaller inward current carried by guanidinium ion through CNG channels (25).
Fig. 4
Fig. 4
(A) Unitary responses for two odorants with different potencies on the same cell are very similar. (Top) Relation between response amplitude and odorant concentration for acetophenone and cineole odorants. Each point represents the average of four to eight stimulus trials. Although the duration of acetophenone stimulation was twice as long as that for cineole, the response with all receptors bound by acetophenone was a factor of 7 less than the response to cineole. (Bottom) Variance/mean analysis of the unitary response to the two odorants. The quantal responses to the two odorants were similar (0.48 pA for cineole and 0.56 pA for acetophenone). Thirty trials each of 100 µM cineole at 25-ms duration and 2 mM acetophenone at 50-ms duration. The two stimuli were chosen to produce responses of comparable amplitudes. The slight difference in response kinetics for the two odorants was due to a change in cell condition during the experiment; this was not observed in other experiments. We chose this cell because of the large difference in efficacy between the two odorants. (B) Estimation of cineole dwell-time on the receptor. (Top) Relation between response amplitude and cineole concentration at two durations. Even when all receptors were bound (≥1 mM cineole), the response amplitude increased linearly with the odorant pulse duration. Each point represents the average of 3 to 20 stimulus trials. (Bottom) Complete data from the same experiment at a saturating cineole concentration of 2 mM and applied for four different durations. (Inset) Linear increase of the response with odorant duration. The time intercept of the linear-regression fit is near zero.

Similar articles

Cited by

References

    1. Buck LB. Cell. 2000;100:611. - PubMed
    1. Schild D, Restrepo D. Physiol. Rev. 1998;78:429. - PubMed
    1. Matthews HR, Reisert J. Curr. Opin. Neurobiol. 2003;13:469. - PubMed
    1. Menini A, Picco C, Firestein S. Nature. 1995;373:435. - PubMed
    1. Lowe G, Gold GH. Proc. Natl. Acad. Sci. U.S.A. 1995;92:7864. - PMC - PubMed

Publication types

MeSH terms