

Differences between left and right ventricular chamber geometry affect cardiac vulnerability to electric shocks
- PMID: 15976315
- PMCID: PMC2925187
- DOI: 10.1161/01.RES.0000174429.00987.17
Differences between left and right ventricular chamber geometry affect cardiac vulnerability to electric shocks
Abstract
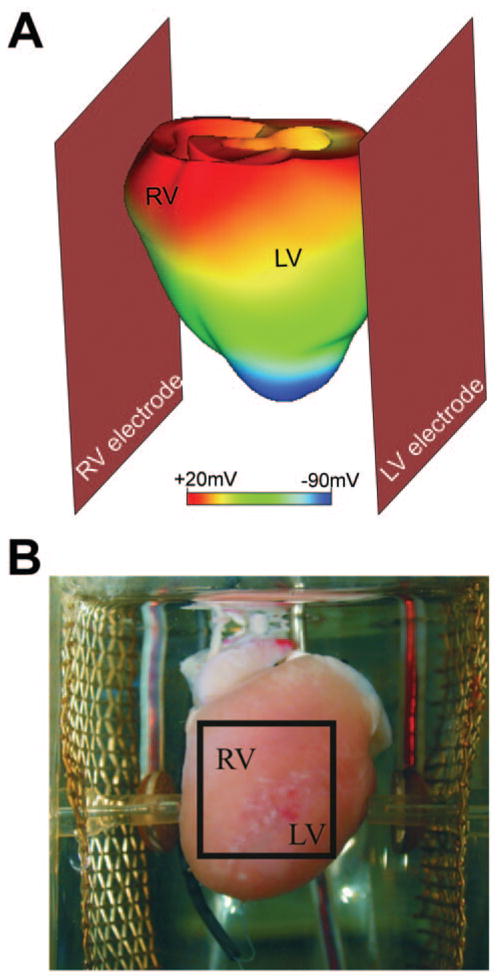
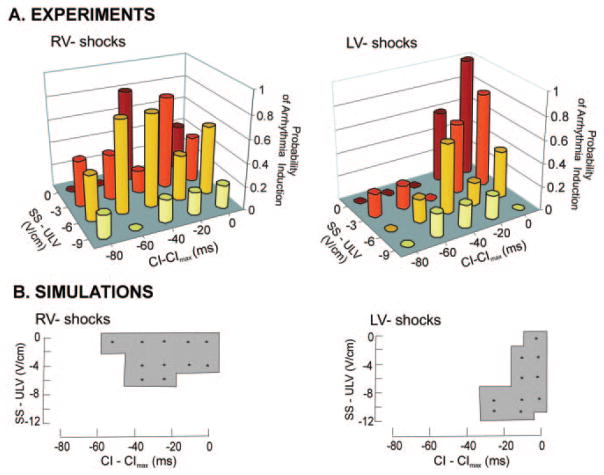
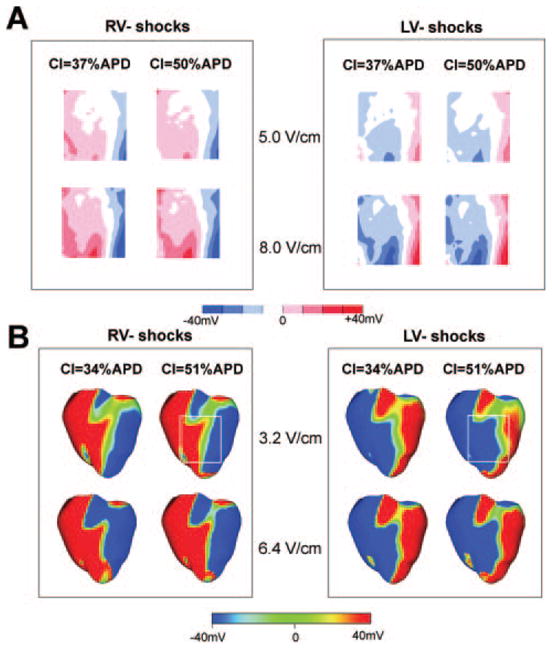
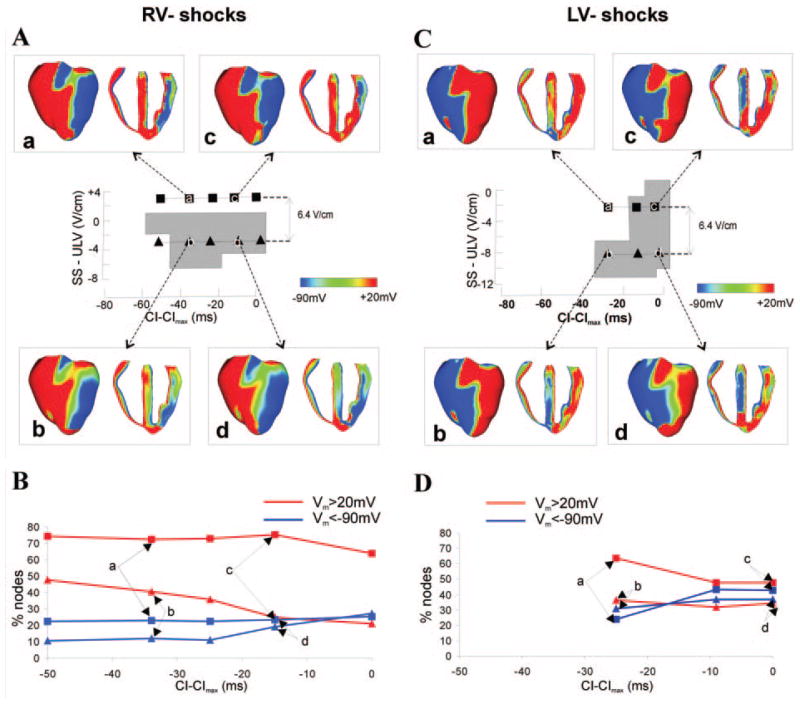
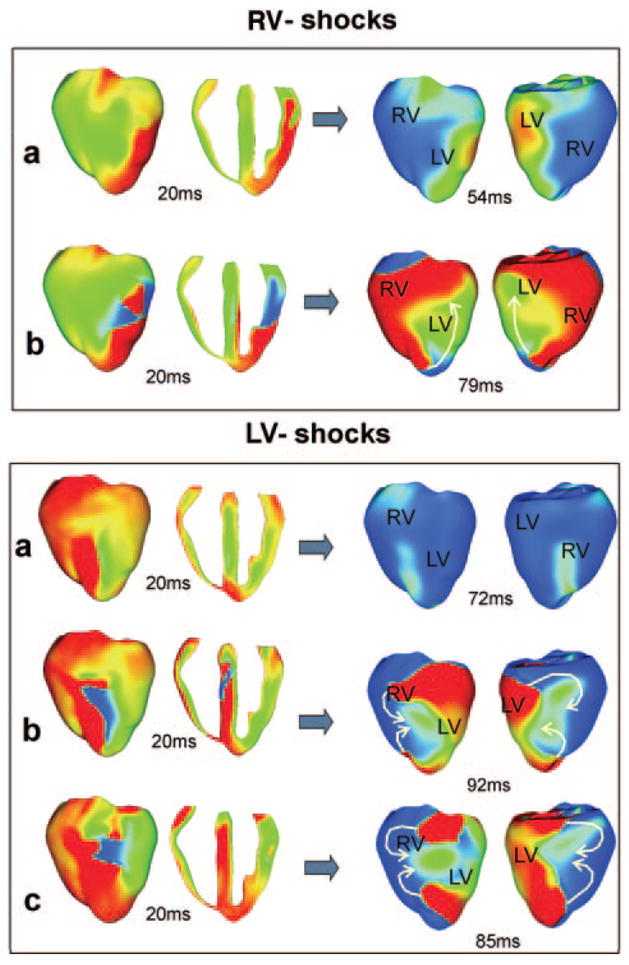
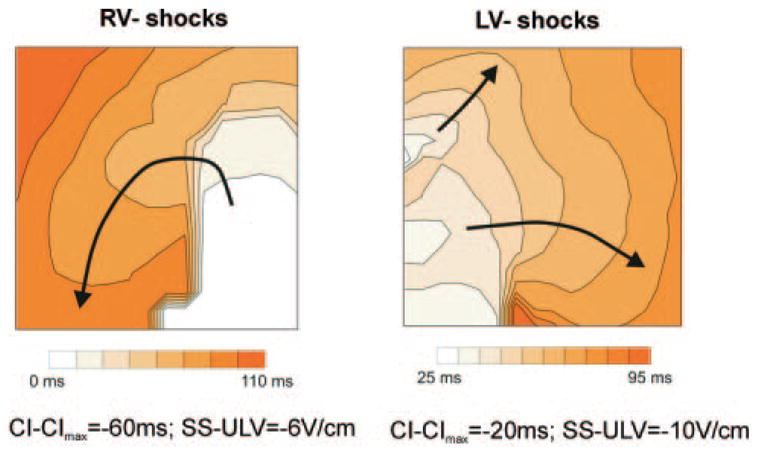
Although effects of shock strength and waveform on cardiac vulnerability to electric shocks have been extensively documented, the contribution of ventricular anatomy to shock-induced polarization and postshock propagation and thus, to shock outcome, has never been quantified; this is caused by lack of experimental methodology capable of mapping 3-D electrical activity. The goal of this study was to use optical imaging experiments and 3-D bidomain simulations to investigate the role of structural differences between left and right ventricles in vulnerability to electric shocks in rabbit hearts. The ventricles were paced apically, and uniform-field, truncated-exponential, monophasic shocks of reversed polarity were applied over a range of coupling intervals (CIs) in experiment and model. Experiments and simulations revealed that reversing the direction of externally-applied field (RV- or LV- shocks) alters the shape of the vulnerability area (VA), the 2-D grid encompassing episodes of arrhythmia induction. For RV- shocks, VA was nearly rectangular indicating little dependence of postshock arrhythmogenesis on CI. For LV- shocks, the probability of arrhythmia induction was higher for longer than for shorter CIs. The 3-D simulations demonstrated that these effects stem from the fact that reversal of field direction results in relocation of the main postshock excitable area from LV wall (RV- shocks) to septum (LV- shocks). Furthermore, the effect of septal (but not LV) excitable area in postshock propagation was found to strongly depend on preshock state. Knowledge regarding the location of the main postshock excitable area within the 3-D ventricular volume could be important for improving defibrillation efficacy.
Figures
Similar articles
-
Differences between left and right ventricular anatomy determine the types of reentrant circuits induced by an external electric shock. A rabbit heart simulation study.Prog Biophys Mol Biol. 2006 Jan-Apr;90(1-3):399-413. doi: 10.1016/j.pbiomolbio.2005.06.008. Epub 2005 Jul 11. Prog Biophys Mol Biol. 2006. PMID: 16055175
-
Polarity reversal lowers activation time during diastolic field stimulation of the rabbit ventricles: insights into mechanisms.Am J Physiol Heart Circ Physiol. 2008 Oct;295(4):H1626-33. doi: 10.1152/ajpheart.00706.2008. Epub 2008 Aug 15. Am J Physiol Heart Circ Physiol. 2008. PMID: 18708441 Free PMC article.
-
Tunnel propagation following defibrillation with ICD shocks: hidden postshock activations in the left ventricular wall underlie isoelectric window.Heart Rhythm. 2010 Jul;7(7):953-61. doi: 10.1016/j.hrthm.2010.03.026. Epub 2010 Mar 25. Heart Rhythm. 2010. PMID: 20348028 Free PMC article.
-
The role of transmural ventricular heterogeneities in cardiac vulnerability to electric shocks.Prog Biophys Mol Biol. 2008 Jan-Apr;96(1-3):321-38. doi: 10.1016/j.pbiomolbio.2007.07.017. Epub 2007 Aug 22. Prog Biophys Mol Biol. 2008. PMID: 17915299 Free PMC article. Review.
-
Defibrillation of the heart: insights into mechanisms from modelling studies.Exp Physiol. 2006 Mar;91(2):323-37. doi: 10.1113/expphysiol.2005.030973. Epub 2006 Feb 9. Exp Physiol. 2006. PMID: 16469820 Review.
Cited by
-
Automatically generated, anatomically accurate meshes for cardiac electrophysiology problems.IEEE Trans Biomed Eng. 2009 May;56(5):1318-30. doi: 10.1109/TBME.2009.2014243. Epub 2009 Feb 6. IEEE Trans Biomed Eng. 2009. PMID: 19203877 Free PMC article.
-
Personalized Imaging and Modeling Strategies for Arrhythmia Prevention and Therapy.Curr Opin Biomed Eng. 2018 Mar;5:21-28. doi: 10.1016/j.cobme.2017.11.007. Curr Opin Biomed Eng. 2018. PMID: 29546250 Free PMC article.
-
Type 1 Diabetes Impairs Cardiomyocyte Contractility in the Left and Right Ventricular Free Walls but Preserves It in the Interventricular Septum.Int J Mol Sci. 2022 Feb 2;23(3):1719. doi: 10.3390/ijms23031719. Int J Mol Sci. 2022. PMID: 35163643 Free PMC article.
-
Cardiovascular disease models: A game changing paradigm in drug discovery and screening.Biomaterials. 2019 Apr;198:3-26. doi: 10.1016/j.biomaterials.2018.09.036. Epub 2018 Oct 1. Biomaterials. 2019. PMID: 30343824 Free PMC article. Review.
-
Novel micropatterned cardiac cell cultures with realistic ventricular microstructure.Biophys J. 2009 May 6;96(9):3873-85. doi: 10.1016/j.bpj.2009.02.019. Biophys J. 2009. PMID: 19413993 Free PMC article.
References
-
- Chen PS, Feld GK, Mower MM, Peters BB. Effects of pacing rate and timing of defibrillation shock on the relation between the defibrillation threshold and the upper limit of vulnerability in open chest dogs. J Am Coll Cardiol. 1991;18:1555–1563. - PubMed
-
- Malkin RA, Idriss SF, Walker RG, Ideker RE. Effect of rapid pacing and T-wave scanning on the relation between the defibrillation and upper-limit-of-vulnerability dose-response curves. Circulation. 1995;92(5):1291–1299. - PubMed
-
- Chen PS, Shibata N, Dixon EG, Martin RO, Ideker RE. Comparison of the defibrillation threshold and the upper limit of ventricular vulnerability. Circulation. 1986;73:1022–1028. - PubMed
-
- Chen PS, Feld GK, Kriett JM, Mower MM, Tarazi RY, Fleck RP, Swerdlow CD, Gang ES, Kass RM. Relation between upper limit of vulnerability and defibrillation threshold in humans. Circulation. 1993;88:186–192. - PubMed
Publication types
MeSH terms
Grants and funding
LinkOut - more resources
Full Text Sources
Other Literature Sources
