

X-ray spectroscopy of the Mn4Ca cluster in the water-oxidation complex of Photosystem II
- PMID: 15977060
- PMCID: PMC3962501
- DOI: 10.1007/s11120-005-0638-9
X-ray spectroscopy of the Mn4Ca cluster in the water-oxidation complex of Photosystem II
Abstract
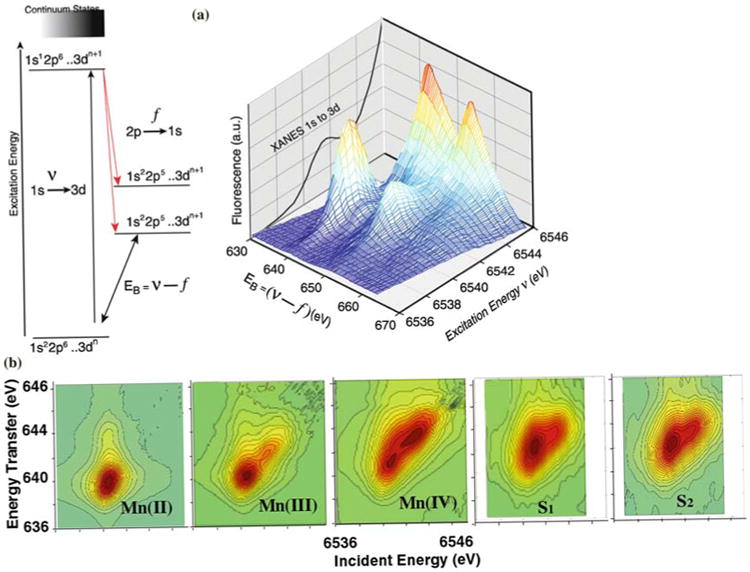
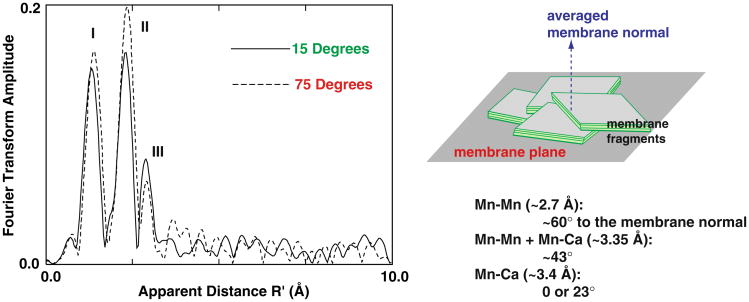
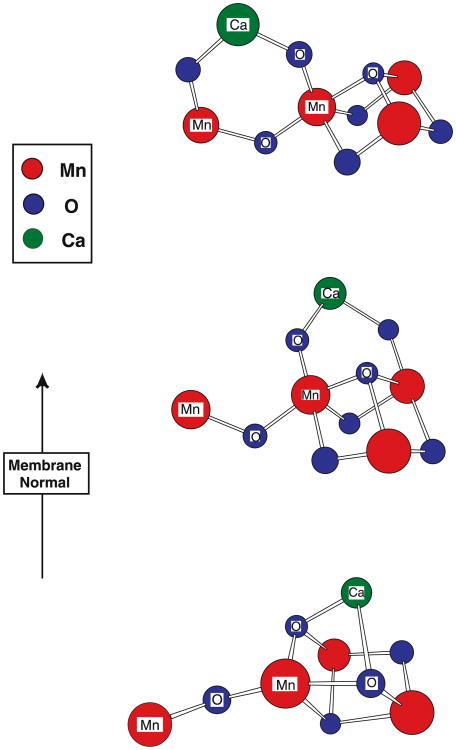
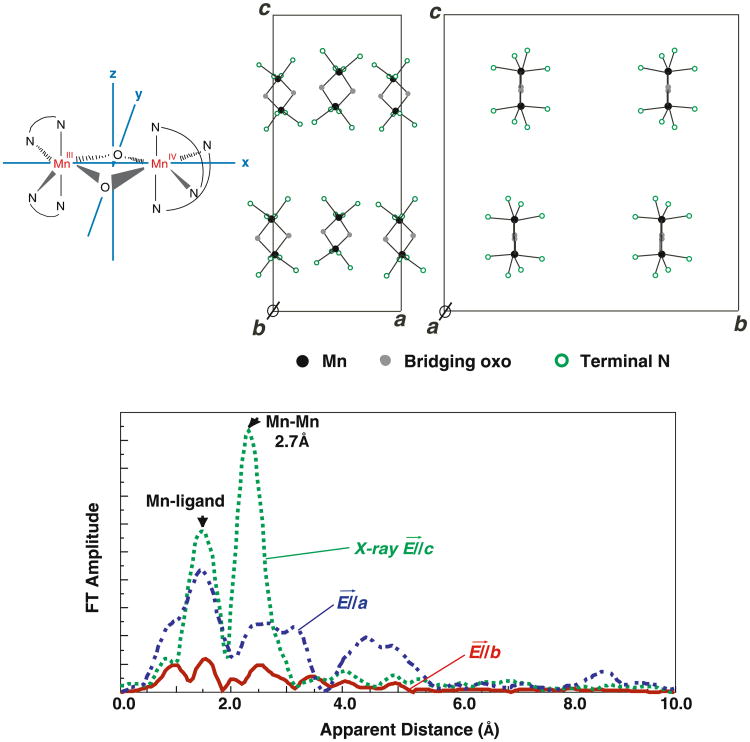
The water-oxidation complex of Photosystem II (PS II) contains a heteronuclear cluster of 4 Mn atoms and a Ca atom. Ligands to the metal cluster involve bridging O atoms, and O and N atoms from amino acid side-chains of the D1 polypeptide of PS II, with likely additional contributions from water and CP43. Although moderate resolution X-ray diffraction-based structures of PS II have been reported recently, and the location of the Mn4Ca cluster has been identified, the structures are not resolved at the atomic level. X-ray absorption (XAS), emission (XES), resonant inelastic X-ray scattering (RIXS) and extended X-ray absorption fine structure (EXAFS) provide independent and potentially highly accurate sources of structural and oxidation-state information. When combined with polarized X-ray studies of oriented membranes or single-crystals of PS II, a more detailed picture of the cluster and its disposition in PS II is obtained.
Figures


Similar articles
-
High-resolution structure of the photosynthetic Mn4Ca catalyst from X-ray spectroscopy.Philos Trans R Soc Lond B Biol Sci. 2008 Mar 27;363(1494):1139-47; discussion 1147. doi: 10.1098/rstb.2007.2209. Philos Trans R Soc Lond B Biol Sci. 2008. PMID: 17954437 Free PMC article. Review.
-
Where water is oxidized to dioxygen: structure of the photosynthetic Mn4Ca cluster from X-ray spectroscopy.Inorg Chem. 2008 Mar 17;47(6):1711-26. doi: 10.1021/ic7016837. Inorg Chem. 2008. PMID: 18330965 Free PMC article.
-
Where water is oxidized to dioxygen: structure of the photosynthetic Mn4Ca cluster.Science. 2006 Nov 3;314(5800):821-5. doi: 10.1126/science.1128186. Science. 2006. PMID: 17082458 Free PMC article.
-
Simultaneous femtosecond X-ray spectroscopy and diffraction of photosystem II at room temperature.Science. 2013 Apr 26;340(6131):491-5. doi: 10.1126/science.1234273. Epub 2013 Feb 14. Science. 2013. PMID: 23413188 Free PMC article.
-
FTIR studies of metal ligands, networks of hydrogen bonds, and water molecules near the active site Mn₄CaO₅ cluster in Photosystem II.Biochim Biophys Acta. 2015 Jan;1847(1):19-34. doi: 10.1016/j.bbabio.2014.07.007. Epub 2014 Jul 16. Biochim Biophys Acta. 2015. PMID: 25038513 Review.
Cited by
-
High-resolution Mn EXAFS of the oxygen-evolving complex in photosystem II: structural implications for the Mn4Ca cluster.J Am Chem Soc. 2005 Nov 2;127(43):14974-5. doi: 10.1021/ja054873a. J Am Chem Soc. 2005. PMID: 16248606 Free PMC article.
-
Proton transport facilitating water-oxidation: the role of second sphere ligands surrounding the catalytic metal cluster.Photosynth Res. 2013 Oct;116(2-3):215-29. doi: 10.1007/s11120-013-9907-1. Epub 2013 Aug 24. Photosynth Res. 2013. PMID: 23975203 Review.
-
Substrate water binding and oxidation in photosystem II.Photosynth Res. 2008 Oct-Dec;98(1-3):261-76. doi: 10.1007/s11120-008-9337-7. Epub 2008 Sep 3. Photosynth Res. 2008. PMID: 18766463 Review.
-
Designing photosystem II: molecular engineering of photo-catalytic proteins.Photosynth Res. 2008 Oct-Dec;98(1-3):687-700. doi: 10.1007/s11120-008-9355-5. Epub 2008 Sep 6. Photosynth Res. 2008. PMID: 18777102 Review.
-
No evidence from FTIR difference spectroscopy that aspartate-342 of the D1 polypeptide ligates a Mn ion that undergoes oxidation during the S0 to S1, S1 to S2, or S2 to S3 transitions in photosystem II.Biochemistry. 2007 Mar 20;46(11):3151-60. doi: 10.1021/bi062195e. Epub 2007 Feb 24. Biochemistry. 2007. PMID: 17319696 Free PMC article.
References
-
- Bergmann U, Grush MM, Horne CR, DeMarois P, Penner-Hahn JE, Yocum CF, Wright DW, Dubé CE, Armstrong WH, Christou G, Eppley HJ, Cramer SP. Characterization of the Mn oxidation states in Photosystem II by Kβ X-ray fluorescence spectroscopy. J Phys Chem B. 1998;102:8350–8352.
-
- Biesiadka J, Loll B, Kern J, Irrgang KD, Zouni A. Crystal structure of cyanobacterial Photosystem II at 3.2 Å resolution: A closer look at the Mn-Cluster. Phys Chem Chem Phys. 2004;6:4733–4736.
-
- Blankenship RE. Molecular Mechanisms of Photosynthesis. Blackwell; Oxford: 2002.
-
- Blankenship RE, Madigan MT, Bauer CE, editors. Anoxygenic Photosynthetic Bacteria. Kluwer Academic Publishers; Dordrecht, The Netherlands: 1995.
-
- Britt RD, Campbell KA, Peloquin JM, Gilchrist ML, Aznar CP, Dicus MM, Robblee J, Messinger J. Recent pulsed EPR studies of the Photosystem II oxygen-evolving complex: implications as to water oxidation mechanisms. Biochim Biophys Acta. 2004;1655:158–171. - PubMed
Publication types
MeSH terms
Substances
Grants and funding
LinkOut - more resources
Full Text Sources
