

The Escherichia coli baby cell column: a novel cell synchronization method provides new insight into the bacterial cell cycle
- PMID: 15978072
- PMCID: PMC2973562
- DOI: 10.1111/j.1365-2958.2005.04693.x
The Escherichia coli baby cell column: a novel cell synchronization method provides new insight into the bacterial cell cycle
Abstract
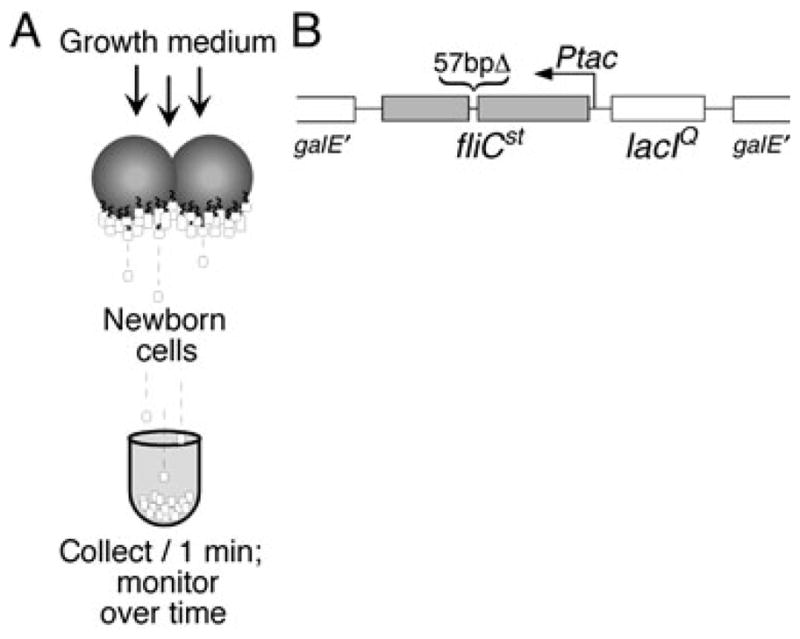
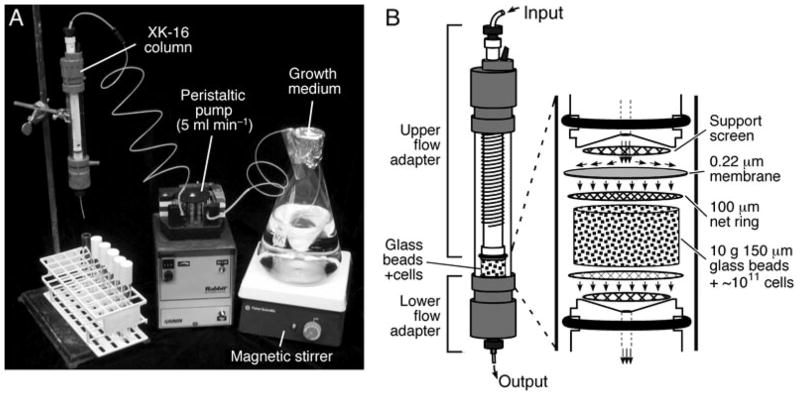
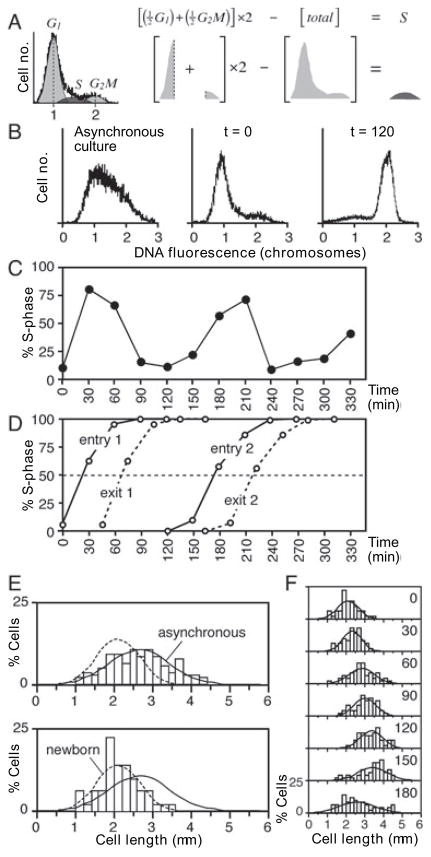
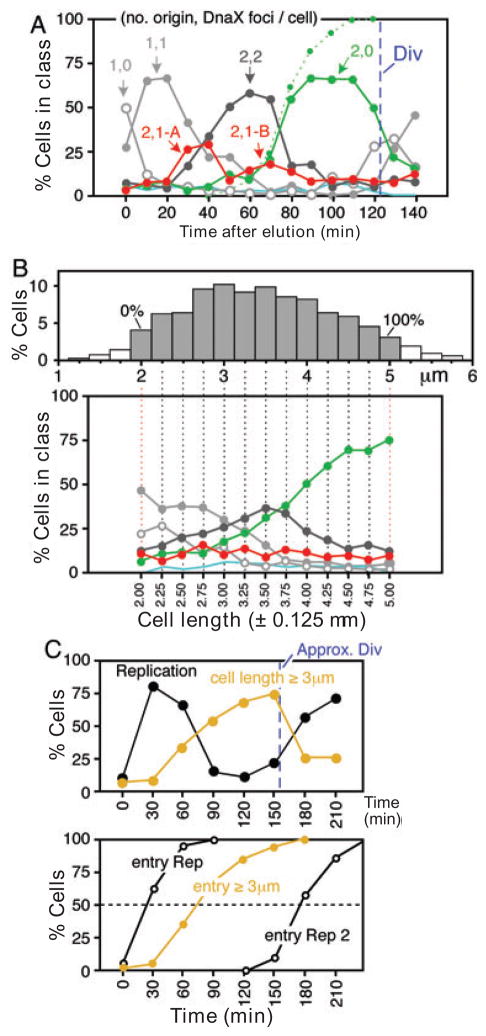
We describe a new method for synchronizing bacterial cells. Cells that have transiently expressed an inducible mutant 'sticky' flagellin are adhered to a volume of glass beads suspended in a chromatography column though which growth medium is pumped. Following repression of flagellin synthesis, newborn cells are eluted from the column in large quantities exceeding that of current baby machine techniques by approximately 10-fold. Eluted cultures of 'baby cells' are highly synchronous as determined by analysis of DNA replication, cell division and other events, over time after elution from the column. We also show that use of 'minutes after elution' as a time metric permits much greater temporal resolution among sequential chromosomal events than the commonly used metric of cell size (length). The former approach reveals the existence of transient intermediate stages that are missed by the latter approach. This finding has two important implications. First, at a practical level, the baby cell column is a particularly powerful method for temporal analysis. Second, at a conceptual level, replication-related events are more tightly linked to cell birth (i.e. cell division) than to absolute cell mass.
Figures

Similar articles
-
Size variations and correlation of different cell cycle events in slow-growing Escherichia coli.J Bacteriol. 1978 May;134(2):423-33. doi: 10.1128/jb.134.2.423-433.1978. J Bacteriol. 1978. PMID: 350822 Free PMC article.
-
Initiation of chromosome replication controls both division and replication cycles in E. coli through a double-adder mechanism.Elife. 2019 Nov 11;8:e48063. doi: 10.7554/eLife.48063. Elife. 2019. PMID: 31710292 Free PMC article.
-
Mu gem2ts DNA integration is not necessary for induction of synchrony of cell division in Escherichia coli K12.Res Microbiol. 1997 Sep-Oct;148(7):585-91. doi: 10.1016/S0923-2508(97)88082-5. Res Microbiol. 1997. PMID: 9765843
-
Instructive simulation of the bacterial cell division cycle.Microbiology (Reading). 2011 Jul;157(Pt 7):1876-1885. doi: 10.1099/mic.0.049403-0. Epub 2011 May 12. Microbiology (Reading). 2011. PMID: 21565934 Review.
-
Regulation of chromosomal replication in E. coli: sequestration and beyond.Cell. 1995 Sep 22;82(6):877-80. doi: 10.1016/0092-8674(95)90020-9. Cell. 1995. PMID: 7553847 Review. No abstract available.
Cited by
-
Model-based deconvolution of cell cycle time-series data reveals gene expression details at high resolution.PLoS Comput Biol. 2009 Aug;5(8):e1000460. doi: 10.1371/journal.pcbi.1000460. Epub 2009 Aug 14. PLoS Comput Biol. 2009. PMID: 19680537 Free PMC article.
-
Division in Escherichia coli is triggered by a size-sensing rather than a timing mechanism.BMC Biol. 2014 Feb 28;12:17. doi: 10.1186/1741-7007-12-17. BMC Biol. 2014. PMID: 24580833 Free PMC article.
-
The Quantification of Bacterial Cell Size: Discrepancies Arise from Varied Quantification Methods.Life (Basel). 2023 May 24;13(6):1246. doi: 10.3390/life13061246. Life (Basel). 2023. PMID: 37374027 Free PMC article.
-
Microfluidic device for automated synchronization of bacterial cells.Anal Chem. 2012 Oct 16;84(20):8571-8. doi: 10.1021/ac301565g. Epub 2012 Oct 3. Anal Chem. 2012. PMID: 23030473 Free PMC article.
-
Ribosome biogenesis in replicating cells: Integration of experiment and theory.Biopolymers. 2016 Oct;105(10):735-751. doi: 10.1002/bip.22892. Biopolymers. 2016. PMID: 27294303 Free PMC article.
References
-
- Berg HC. E. Coli in Motion. New York: Springer; 2004.
-
- Carl PL. Escherichia coli mutants with temperature-sensitive synthesis of DNA. Mol Gen Genet. 1970;109:107–122. - PubMed
Publication types
MeSH terms
Substances
Grants and funding
LinkOut - more resources
Full Text Sources
Other Literature Sources
