Comparative Study
. 2005 Aug 15;339(1):110-26.
doi: 10.1016/j.virol.2005.05.025.

Early detection of dominant Env-specific and subdominant Gag-specific CD8+ lymphocytes in equine infectious anemia virus-infected horses using major histocompatibility complex class I/peptide tetrameric complexes

Affiliations
Comparative Study

Early detection of dominant Env-specific and subdominant Gag-specific CD8+ lymphocytes in equine infectious anemia virus-infected horses using major histocompatibility complex class I/peptide tetrameric complexes

Robert H Mealey et al. Virology. .

Abstract

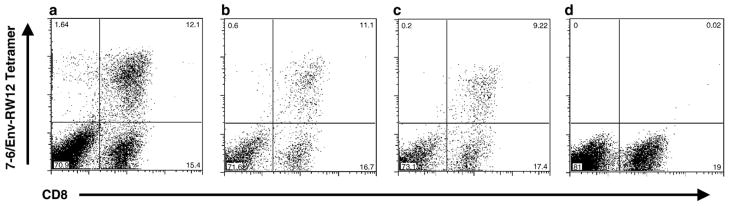
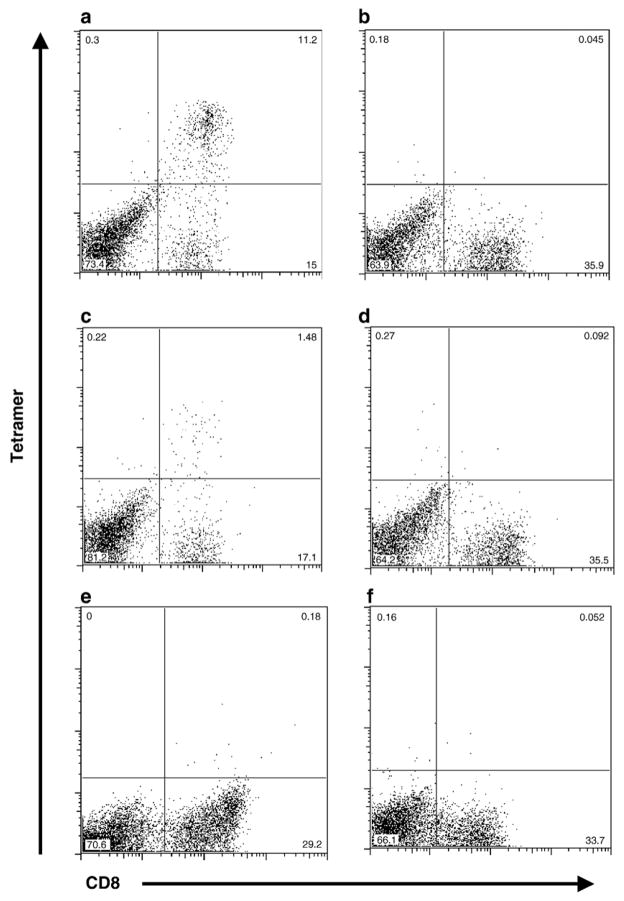
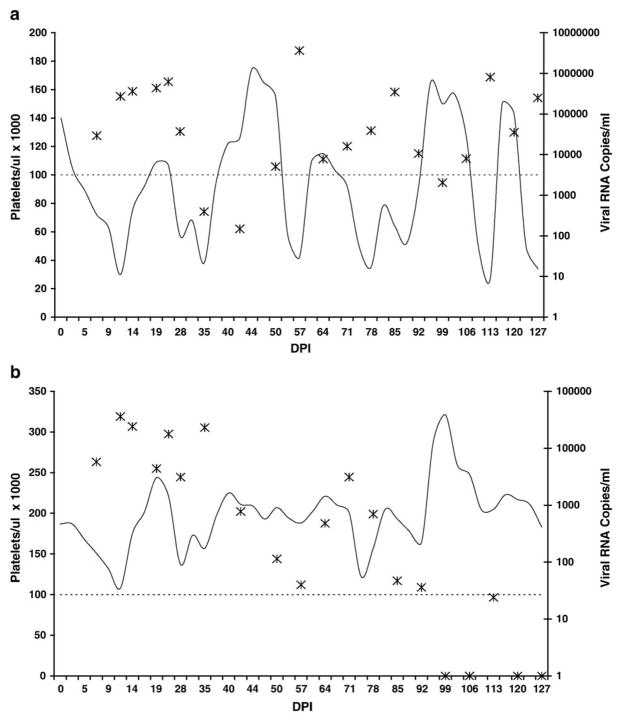
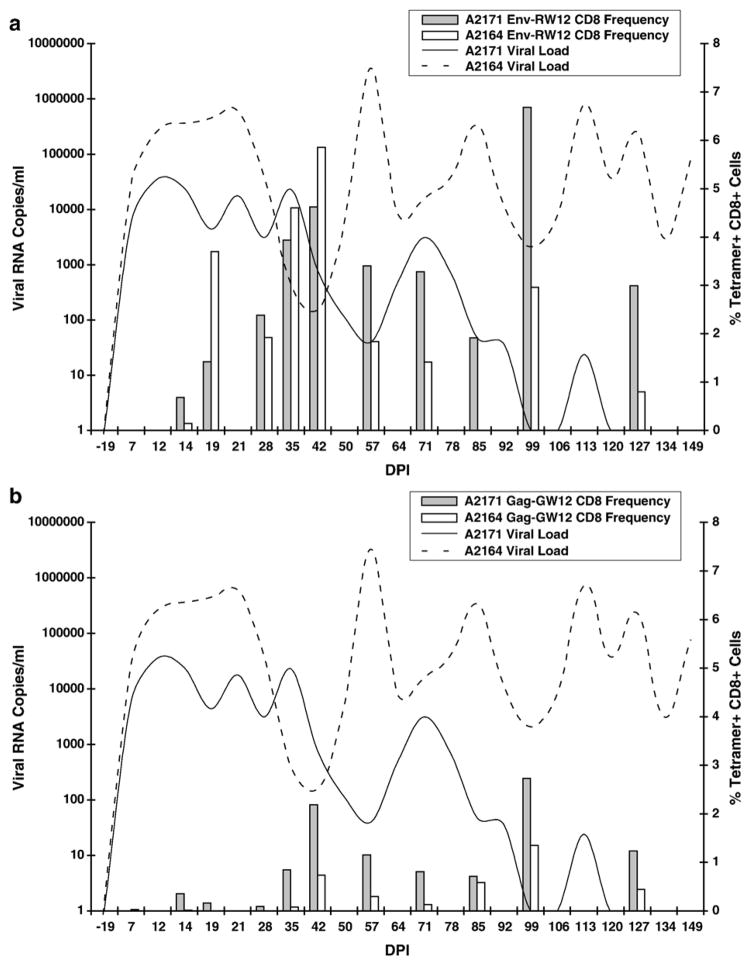
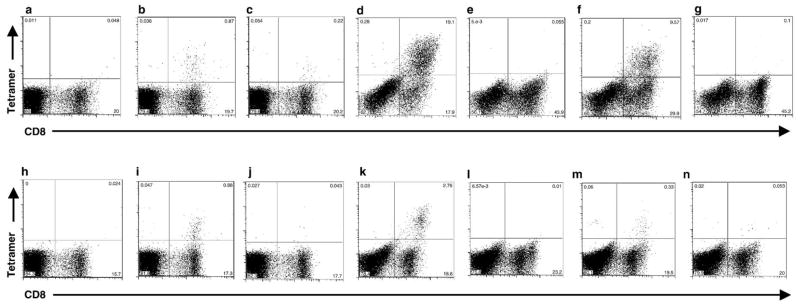
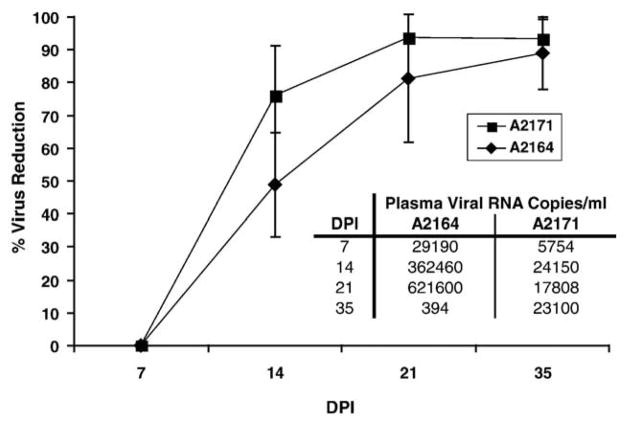
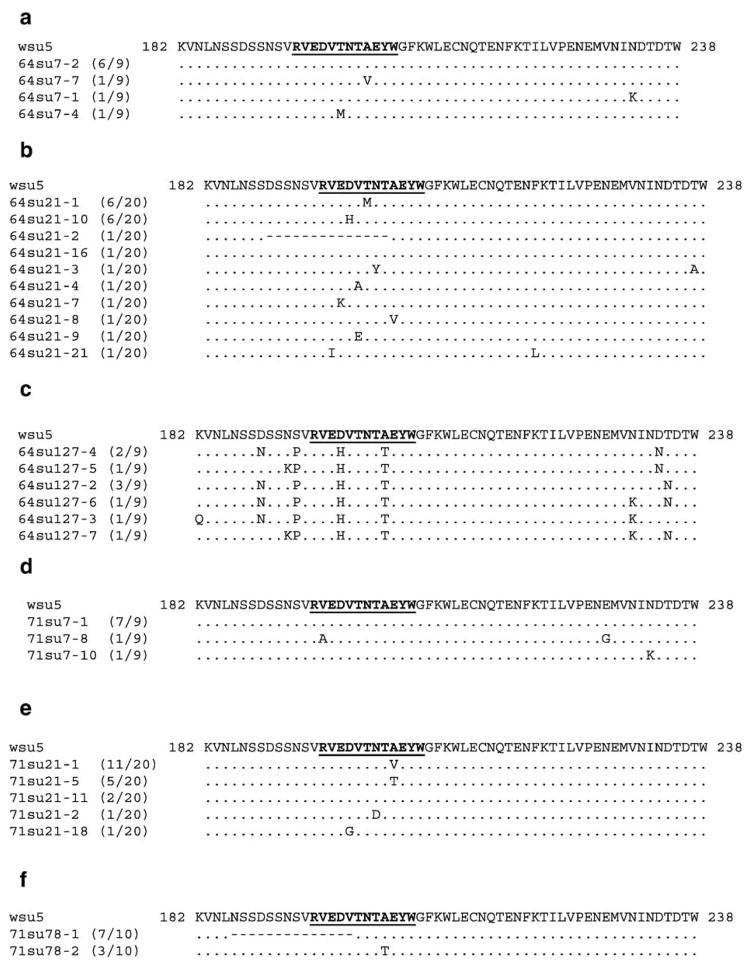
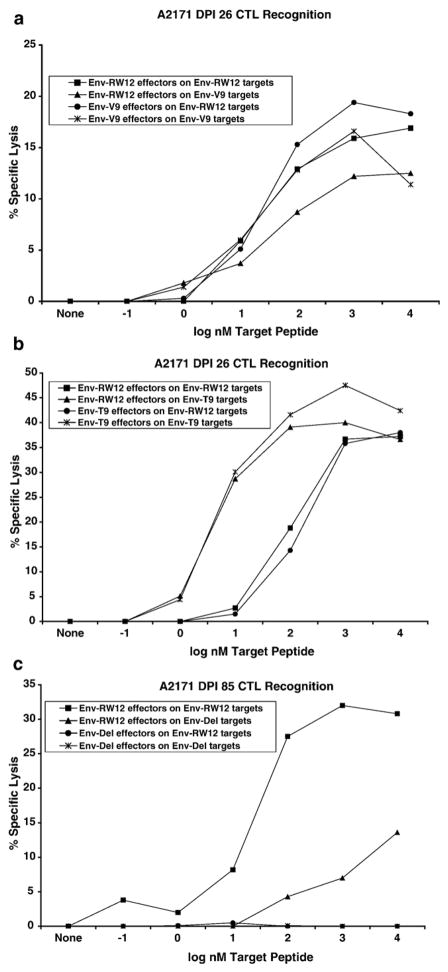
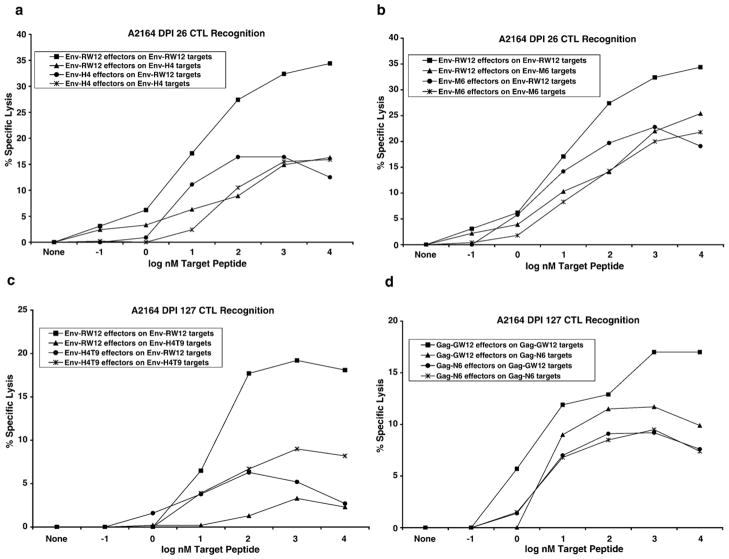
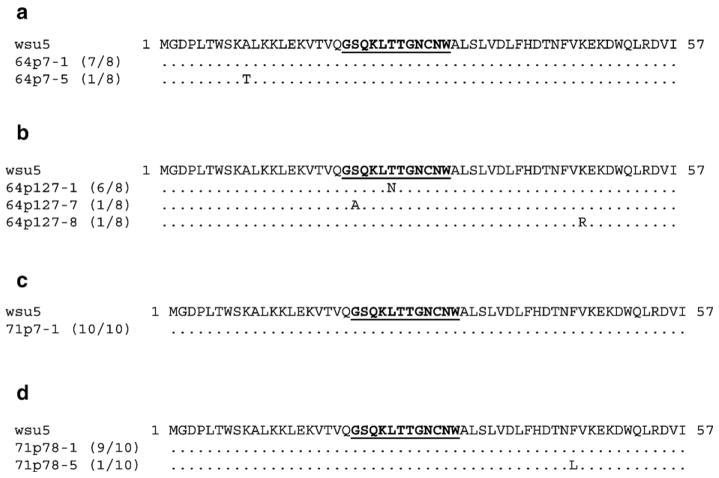
Cytotoxic T lymphocytes (CTL) are critical for control of lentiviruses, including equine infectious anemia virus (EIAV). Measurement of equine CTL responses has relied on chromium-release assays, which do not allow accurate quantitation. Recently, the equine MHC class I molecule 7-6, associated with the ELA-A1 haplotype, was shown to present both the Gag-GW12 and Env-RW12 EIAV CTL epitopes. In this study, 7-6/Gag-GW12 and 7-6/Env-RW12 MHC class I/peptide tetrameric complexes were constructed and used to analyze Gag-GW12- and Env-RW12-specific CTL responses in two EIAV-infected horses (A2164 and A2171). Gag-GW12 and Env-RW12 tetramer-positive CD8+ cells were identified in nonstimulated peripheral blood mononuclear cells as early as 14 days post-EIAV inoculation, and frequencies of tetramer-positive cells ranged from 0.4% to 6.7% of nonstimulated peripheral blood CD8+ cells during the 127-day study period. Although both horses terminated the initial viremic peak, only horse A2171 effectively controlled viral load. Neutralizing antibody was present during the initial control of viral load in both horses, but the ability to maintain control correlated with Gag-GW12-specific CD8+ cells in A2171. Despite Env-RW12 dominance, Env-RW12 escape viral variants were identified in both horses and there was no correlation between Env-RW12-specific CD8+ cells and control of viral load. Although Gag-GW12 CTL escape did not occur, a Gag-GW12 epitope variant arose in A2164 that was recognized less efficiently than the original epitope. These data indicate that tetramers are useful for identification and quantitation of CTL responses in horses, and suggest that the observed control of EIAV replication and clinical disease was associated with sustained CTL recognition of Gag-specific epitopes.


Figures

Fig. 1
Fig. 1
PBMC from EIAV-infected horse A2140, stimulated for 7 days with 10 μM Env-RW12 peptide, then labeled with anti-equine CD8 and the following serial dilutions of the 7-6/Env-RW12 tetramer: (a) 1:8; (b) 1:16; (c) 1:32; (d) no tetramer.
Fig. 2
Fig. 2
(a) PBMC from EIAV-infected horse A2140, stimulated for 7 days with Env-RW12 peptide, then labeled with anti-equine CD8 and the 7-6/Env-RW12 tetramer. (b) PBMC from EIAV-infected horse A2147, stimulated for 7 days with Gag-FK10 peptide, then labeled with anti-equine CD8 and the 7-6/Env-RW12 tetramer. (c) A2140 PBMC stimulated for 7 days with Gag-GW12 peptide, then labeled with anti-equine CD8 and the 7-6/Gag-GW12 tetramer. (d) Gag-FK10-stimulated A2147 PBMC labeled with anti-equine CD8 and the 7-6/Gag-GW12 tetramer. (e) Gag-GW12-stimulated A2140 PBMC labeled with anti-equine CD8 and the 7-6/Env-RW12 tetramer. (f) Env-RW12-stimulated A2140 PBMC labeled with anti-equine CD8 and the 7-6/Gag-GW12 tetramer.
Fig. 3
Fig. 3
(a) Platelet counts (solid line) and plasma viral load (asterisks) in EIAV-infected horse A2164. The dotted line indicates the cutoff for thrombocytopenia (100,000 platelets/μl). DPI, days post-EIAV inoculation. (b) Platelet counts and plasma viral load in EIAV-infected horse A2171. Annotations are the same as for panel a.
Fig. 4
Fig. 4
(a) Plasma viral load in A2164 (dotted line) and A2171 (solid line), and Env-RW12-specific CD8+ cell frequency (percentage of CD8+ nonstimulated PBMC that were 7-6/Env-RW12 tetramer positive) in A2164 (white bars) and A2171 (gray bars). DPI, days post-EIAV inoculation. (b) Plasma viral load in A2164 (dotted line) and A2171 (solid line), and Gag-GW12-specific CD8+ cell frequency (percentage of CD8+ nonstimulated PBMC that were 7-6/Gag-GW12 tetramer positive) in A2164 (white bars) and A2171 (gray bars).
Fig. 5
Fig. 5
Representative anti-equine CD8 and tetramer staining for DPI 35 PBMC from A2171 (a–g) and A2164 (h–n). (a, h) Nonstimulated PBMC with no tetramer labeling. (b, i) Nonstimulated PBMC labeled with the 7-6/Env-RW12 tetramer. (c, j) Nonstimulated PBMC labeled with the 7-6/Gag-GW12 tetramer. (d, k) Env-RW12-stimulated PBMC labeled with the 7-6/Env-RW12 tetramer. (e, l) Env-RW12-stimulated PBMC labeled with the 7-6/Gag-GW12 tetramer. (f, m) Gag-GW12-stimulated PBMC labeled with the 7-6/Gag-GW12 tetramer. (g, n) Gag-GW12-stimulated PBMC labeled with the 7-6/Env-RW12 tetramer.
Fig. 6
Fig. 6
Neutralizing antibody activity in A2164 and A2171, determined by incubating equal volumes of test plasma with EIAV stock virus followed by titration in cell culture. % virus reduction was calculated by subtracting the TCID50 obtained using test plasma from the TCID50 obtained using negative control plasma, and dividing the result by the TCID50 obtained using negative control plasma. The end result was multiplied by 100. Each data point represents the mean of three separate assays. Error bars are 2 SD. DPI, days post-EIAV inoculation. Plasma viral loads (viral RNA copies/ml) for A2164 and A2171 on the days assayed for neutralizing antibody are tabulated for reference.
Fig. 7
Fig. 7
(a) Deduced amino acid sequences of EIAVWSU5 SU env clones (SU amino acids 182–238) obtained from A2164 DPI 7 plasma. The EIAVWSU5 consensus sequence (GenBank accession no. AF247394) is shown and the Env-RW12 CTL epitope is in bold and underlined. The number of clones with a given sequence over the total number of sequenced clones is indicated in parentheses to the right of the clone name. (b) Deduced amino acid sequences of EIAVWSU5 SU env clones obtained from A2164 DPI 21 plasma. Annotations are the same as for panel a. (c) Deduced amino acid sequences of EIAVWSU5 SU env clones obtained from A2164 DPI 127 plasma. Annotations are the same as for panel a. (d) Deduced amino acid sequences of EIAVWSU5 SU env clones obtained from A2171 DPI 7 plasma. Annotations are the same as for panel a. (e) Deduced amino acid sequences of EIAVWSU5 SU env clones obtained from A2171 DPI 21 plasma. Annotations are the same as for panel a. (f) Deduced amino acid sequences of EIAVWSU5 SU env clones obtained from A2171 DPI 78 plasma. Annotations are the same as for panel a.
Fig. 8
Fig. 8
A2171 CTL recognition of ELA-A1-matched equine kidney (EK) target cells pulsed with original or epitope variant peptides. Chromium-release assays used EK targets pulsed with increasing concentrations of each peptide (10−1 to 104 nM), and an effector:target ratio of 20:1. Effectors were cryopreserved PBMC stimulated for 7 days with the original or the variant epitope peptides. Specific lysis values are shown after subtraction of background (specific lysis of targets not pulsed with peptide). (a) DPI 26 CTL recognition of the original epitope peptide Env-RW12 (RVEDVTN-TAEYW) and the DPI 21 plasma virus epitope variant Env-V9 (RVEDVTNTVEYW). (b) DPI 26 CTL recognition of the original epitope peptide Env-RW12 and the DPI 21 plasma virus epitope variant Env-T9 (RVEDVTNTTEYW). (c) DPI 85 CTL recognition of the original epitope peptide Env-RW12 and the DPI 78 plasma virus epitope variant Env-Del (KKVNLTNTAEYW).
Fig. 9
Fig. 9
A2164 CTL recognition of ELA-A1-matched equine kidney (EK) target cells pulsed with original or epitope variant peptides. Chromium-release assays used EK targets pulsed with increasing concentrations of each peptide (10−1 to 104 nM), and an effector:target ratio of 20:1. Effectors were cryopreserved PBMC stimulated for 7 days with the original or the variant epitope peptides. Specific lysis values are shown after subtraction of background (specific lysis of targets not pulsed with peptide). (a) DPI 26 CTL recognition of the original epitope peptide Env-RW12 and the DPI 21 plasma virus epitope variant Env-H4 (RVEHVTNTAEYW). (b) DPI 26 CTL recognition of the original epitope peptide Env-RW12 and the DPI 21 plasma virus epitope variant Env-M6 (RVEDVMNTAEYW). (c) DPI 127 CTL recognition of the original epitope peptide Env-RW12 and the DPI 127 plasma virus epitope variant Env-H4T9 (RVEHVTNTTEYW). (d) DPI 127 CTL recognition of the original epitope peptide Gag-GW12 (GSQKLTTGNCNW) and the DPI 127 plasma virus epitope variant Gag-N6 (GSQKLNTGNCNW).
Fig. 10
Fig. 10
(a) Deduced amino acid sequences of EIAVWSU5 gag clones (Gag amino acids 1–57) obtained from A2164 DPI 7 plasma. The EIAVWSU5 consensus sequence (GenBank accession no. AF247394) is shown and the Gag-GW12 CTL epitope is in bold and underlined. Other annotations are the same as for Fig. 7a. (b) Deduced amino acid sequences of EIAVWSU5 gag clones obtained from A2164 DPI 127 plasma. Annotations are the same as for panel a. (c) Deduced amino acid sequences of EIAVWSU5 gag clones obtained from A2171 DPI 7 plasma. Annotations are the same as for panel a. (d) Deduced amino acid sequences of EIAVWSU5 gag clones obtained from A2171 DPI 78 plasma. Annotations are the same as for panel a.

Similar articles

Cited by

References

    1. Altman JD, Moss PA, Goulder PJ, Barouch DH, McHeyzer-Williams MG, Bell JI, McMichael AJ, Davis MM. Phenotypic analysis of antigen-specific T lymphocytes. Science. 1996;274:94–96. - PubMed
    1. Bailey E. Identification and genetics of horse lymphocyte alloantigens. Immunogenetics. 1980;11:499–506. - PubMed
    1. Ball JM, Rushlow KE, Issel CJ, Montelaro RC. Detailed mapping of the antigenicity of the surface unit glycoprotein of equine infectious anemia virus by using synthetic peptide strategies. J Virol. 1992;66:732–742. - PMC - PubMed
    1. Betts MR, Krowka JF, Kepler TB, Davidian M, Christopherson C, Kwok S, Louie L, Eron J, Sheppard H, Frelinger JA. Human immunodeficiency virus type 1-specific cytotoxic T lymphocyte activity is inversely correlated with HIV type 1 viral load in HIV type 1-infected long-term survivors. AIDS Res Hum Retroviruses. 1999;15:1219–1228. - PubMed
    1. Betts MR, Ambrozak DR, Douek DC, Bonhoeffer S, Brenchley JM, Casazza JP, Koup RA, Picker LJ. Analysis of total human immunodeficiency virus (HIV)-specific CD4(+) and CD8(+) T-cell responses: relationship to viral load in untreated HIV infection. J Virol. 2001;75:11983–11991. - PMC - PubMed

Publication types

MeSH terms

Associated data