

Loss of circadian photoentrainment and abnormal retinal electrophysiology in Math5 mutant mice
- PMID: 15980246
- PMCID: PMC1570190
- DOI: 10.1167/iovs.04-1123
Loss of circadian photoentrainment and abnormal retinal electrophysiology in Math5 mutant mice
Abstract
Purpose: To determine how the absence of retinal ganglion cells (RGCs) in Math5 (Atoh7) mutant mice affects circadian behavior and retinal function.
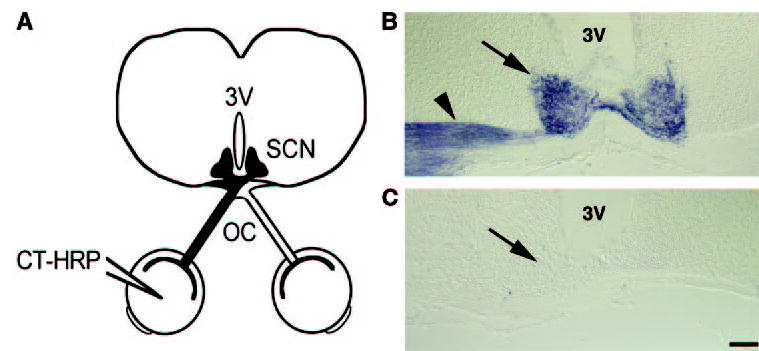
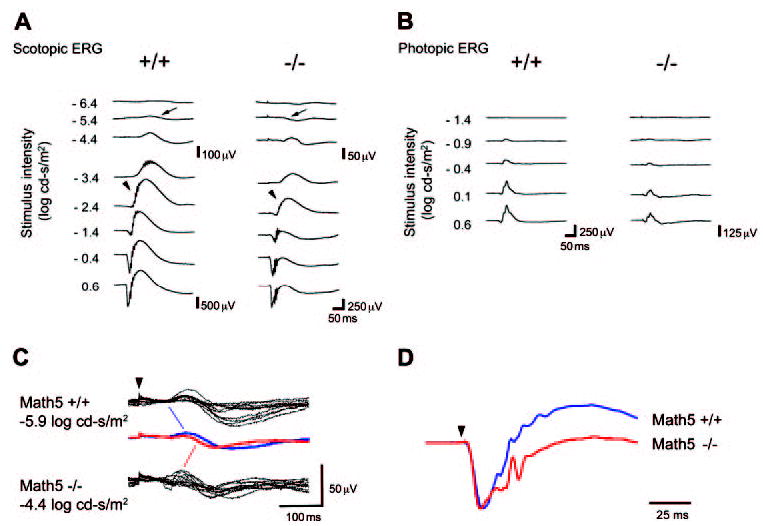
Methods: The wheel-running behavior of wild-type and Math5 mutant mice was measured under various light-dark cycle conditions. To evaluate retinal input to the suprachiasmatic nuclei (SCN) anatomically, the retinohypothalamic tracts were labeled in vivo. To assess changes in retinal function, corneal flash electroretinograms (ERGs) from mutant and wild-type mice were compared under dark- and light-adapted conditions. Alterations in retinal neuron populations were evaluated quantitatively and with cell-type-specific markers.
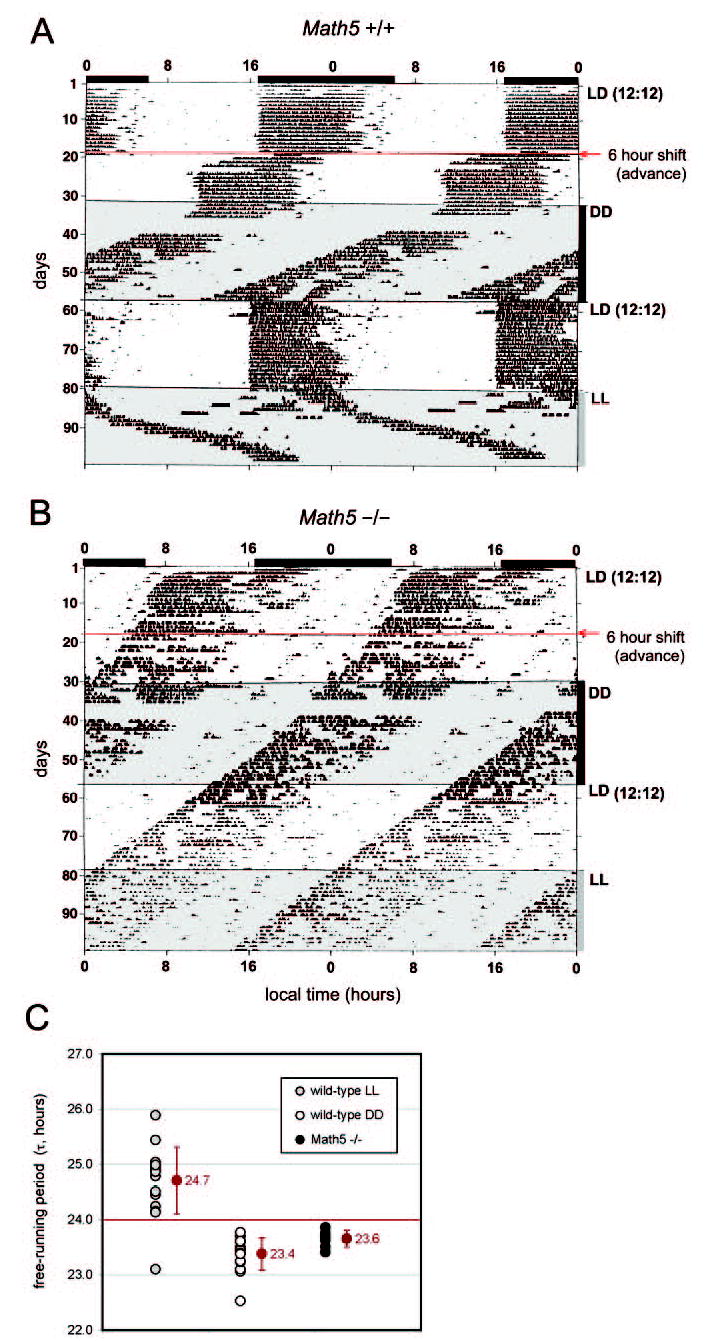
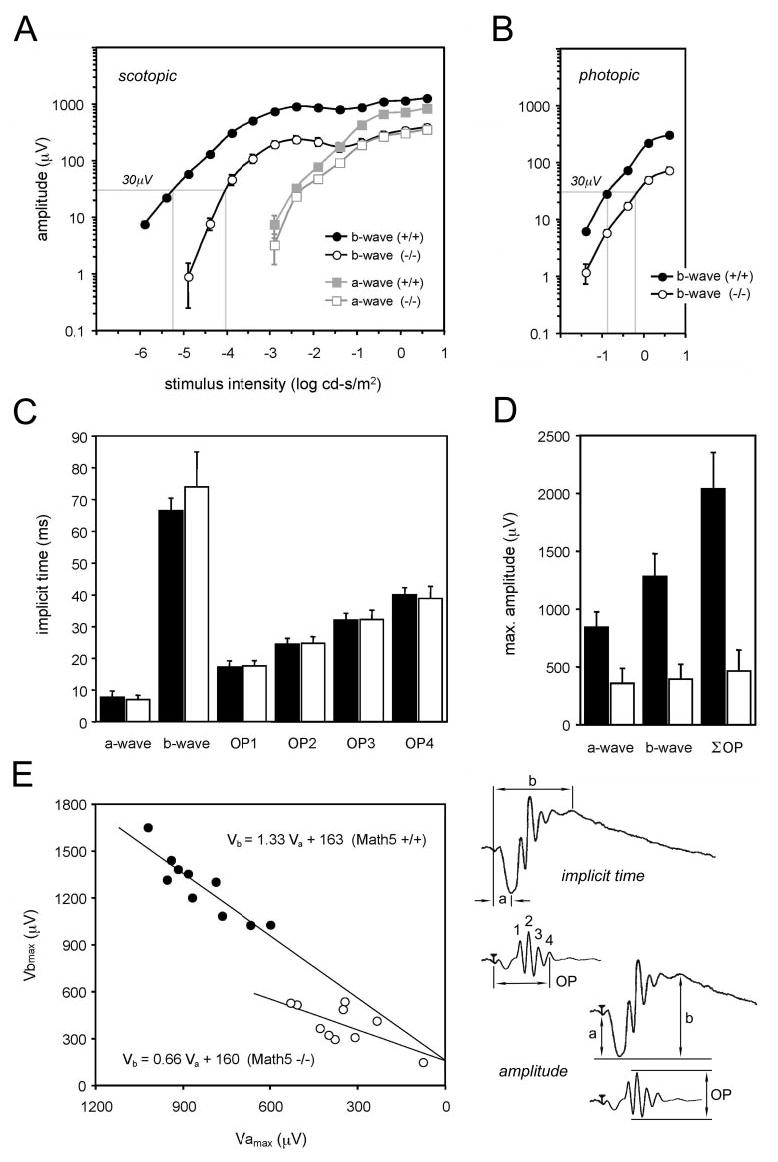
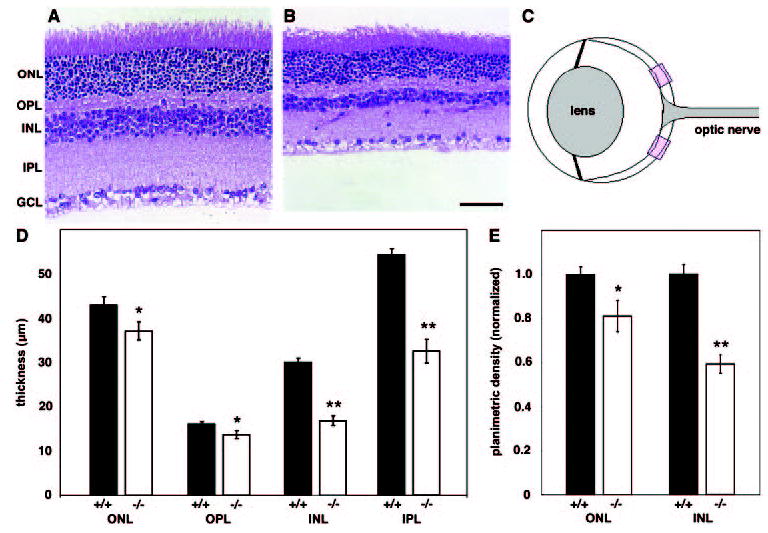
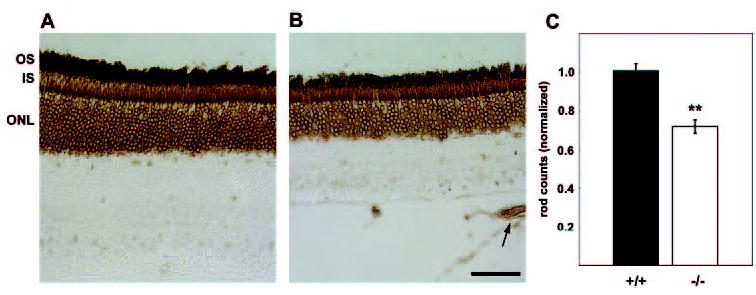
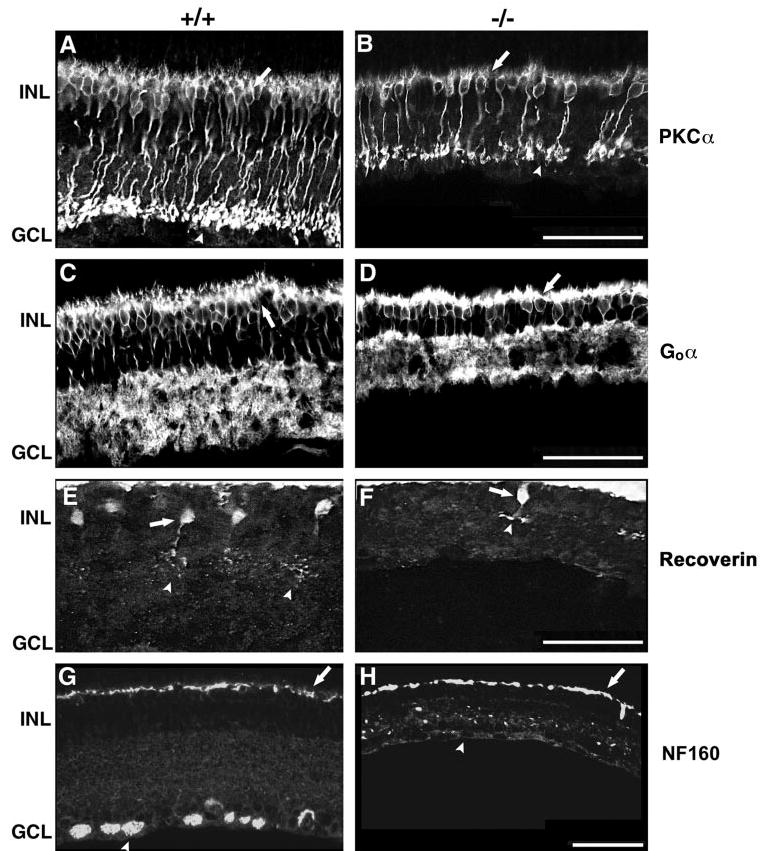
Results: The Math5-null mice did not entrain to light and exhibited free-running circadian behavior with a mean period (23.6 +/- 0.15 hours) that was indistinguishable from that of wild-type mice (23.4 +/- 0.19 hours). The SCN showed no anterograde labeling with a horseradish peroxidase-conjugated cholera toxin B (CT-HRP) tracer. ERGs recorded from mutant mice had diminished scotopic a- and b-wave and photopic b-wave amplitudes. The scotopic b-wave was more severely affected than the a-wave. The oscillatory potentials (OPs) and scotopic threshold response (STR) were also reduced. Consistent with these ERG findings, a pan-specific reduction in the number of bipolar cells and a smaller relative decrease in the number of rods in mutant mice were observed.
Conclusions: Math5-null mice are clock-blind and have no RGC projections to the SCN. RGCs are thus essential for photoentrainment in mice, but are not necessary for the development or intrinsic function of the SCN clock. RGCs are not required to generate any of the major ERG waveforms in mice, including the STR, which is produced by ganglion cells in some other species. The diminished amplitude of b-wave, OPs, and STR components in Math5 mutants is most likely caused by the decreased abundance of retinal interneurons.
Figures
Similar articles
-
Loss of photic entrainment and altered free-running circadian rhythms in math5-/- mice.J Neurosci. 2002 Dec 1;22(23):10427-33. doi: 10.1523/JNEUROSCI.22-23-10427.2002. J Neurosci. 2002. PMID: 12451142 Free PMC article.
-
Math5 is required for retinal ganglion cell and optic nerve formation.Development. 2001 Jul;128(13):2497-508. doi: 10.1242/dev.128.13.2497. Development. 2001. PMID: 11493566 Free PMC article.
-
Assessment of inner retina dysfunction and progressive ganglion cell loss in a mouse model of glaucoma.Exp Eye Res. 2014 May;122:40-9. doi: 10.1016/j.exer.2014.02.022. Epub 2014 Mar 12. Exp Eye Res. 2014. PMID: 24631335
-
The Retinal Circadian Clock and Photoreceptor Viability.Adv Exp Med Biol. 2018;1074:345-350. doi: 10.1007/978-3-319-75402-4_42. Adv Exp Med Biol. 2018. PMID: 29721962 Free PMC article. Review.
-
Melanopsin--shedding light on the elusive circadian photopigment.Chronobiol Int. 2004 Mar;21(2):189-204. doi: 10.1081/cbi-120037816. Chronobiol Int. 2004. PMID: 15332341 Free PMC article. Review.
Cited by
-
The emerging roles of melanopsin in behavioral adaptation to light.Trends Mol Med. 2010 Oct;16(10):435-46. doi: 10.1016/j.molmed.2010.07.005. Epub 2010 Aug 31. Trends Mol Med. 2010. PMID: 20810319 Free PMC article. Review.
-
TRP channel gene expression in the mouse retina.Vision Res. 2011 Dec 8;51(23-24):2440-52. doi: 10.1016/j.visres.2011.10.009. Epub 2011 Oct 20. Vision Res. 2011. PMID: 22037305 Free PMC article.
-
Stem cells, retinal ganglion cells and glaucoma.Dev Ophthalmol. 2014;53:111-21. doi: 10.1159/000358409. Epub 2014 Apr 10. Dev Ophthalmol. 2014. PMID: 24732765 Free PMC article. Review.
-
Deletion of a remote enhancer near ATOH7 disrupts retinal neurogenesis, causing NCRNA disease.Nat Neurosci. 2011 May;14(5):578-86. doi: 10.1038/nn.2798. Epub 2011 Mar 27. Nat Neurosci. 2011. PMID: 21441919 Free PMC article.
-
Atoh7-independent specification of retinal ganglion cell identity.Sci Adv. 2021 Mar 12;7(11):eabe4983. doi: 10.1126/sciadv.abe4983. Print 2021 Mar. Sci Adv. 2021. PMID: 33712461 Free PMC article.
References
-
- Altschuler DM, Turner DL, Cepko CL. Specification of cell type in the vertebrate retina. In: Lam DMK, Shatz CJ, editors. Cell Lineage and Cell Fate in Visual System Development. Cambridge, MA: MIT Press; 1991. pp. 37–58.
-
- Matter-Sadzinski L, Matter JM, Ong MT, Hernandez J, Ballivet M. Specification of neurotransmitter receptor identity in developing retina: the chick ATH5 promoter integrates the positive and negative effects of several bHLH proteins. Development. 2001;128:217–231. - PubMed
-
- Brown NL, Kanekar S, Vetter ML, Tucker PK, Gemza DL, Glaser T. Math5 encodes a murine basic helix-loop-helix transcription factor expressed during early stages of retinal neurogenesis. Development. 1998;125:4821–4833. - PubMed
Publication types
MeSH terms
Substances
Grants and funding
LinkOut - more resources
Full Text Sources
Molecular Biology Databases
