

Drug-induced regulation of the MDR1 promoter in Candida albicans
- PMID: 15980350
- PMCID: PMC1168718
- DOI: 10.1128/AAC.49.7.2785-2792.2005
Drug-induced regulation of the MDR1 promoter in Candida albicans
Abstract
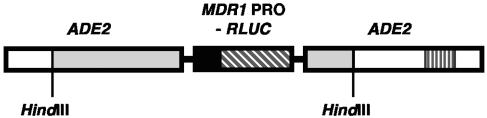
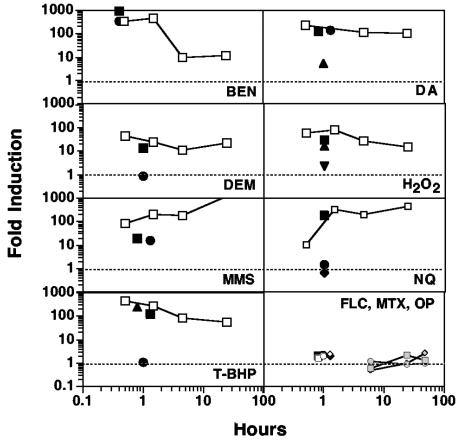
Resistance of Candida albicans to azole antifungal drugs is mediated by two types of efflux pumps, encoded by the MDR1 gene and the CDR gene family. MDR1 mRNA levels in a susceptible clinical isolate are induced by benomyl (BEN) but not by other drugs previously shown to induce MDR1. To monitor MDR1 expression under several conditions, the MDR1 promoter was fused to the Renilla reniformis luciferase reporter gene (RLUC). The promoter was monitored for its responses to four oxidizing agents, five toxic hydrophobic compounds, and an alkylating agent, all shown to induce major facilitator pumps in other organisms. Deletion constructs of the MDR1 promoter were used to analyze the basal transcription of the promoter and its responses to the toxic compound BEN and the oxidizing agent tert-butyl hydrogen peroxide (T-BHP). The cis-acting elements in the MDR1 promoter responsible for induction by BEN were localized between -399 and -299 upstream of the start codon. The cis-acting elements responsible for MDR1 induction by T-BHP were localized between -601 and -500 upstream of the start codon. The T-BHP induction region contains a sequence that resembles the YAP1-responsive element (YRE) in Saccharomyces cerevisiae. This Candida YRE was placed upstream of a noninducible promoter in the luciferase construct, resulting in an inducible promoter. Inversion or mutation of the 7-bp YRE eliminated induction. Many of the drugs used in this analysis induce the MDR1 promoter at concentrations that inhibit cell growth. These analyses define cis-acting elements responsible for drug induction of the MDR1 promoter.
Figures


Similar articles
-
cis-Acting elements within the Candida albicans ERG11 promoter mediate the azole response through transcription factor Upc2p.Eukaryot Cell. 2007 Dec;6(12):2231-9. doi: 10.1128/EC.00331-06. Epub 2007 Oct 19. Eukaryot Cell. 2007. PMID: 17951521 Free PMC article.
-
Gain-of-function mutations in the transcription factor MRR1 are responsible for overexpression of the MDR1 efflux pump in fluconazole-resistant Candida dubliniensis strains.Antimicrob Agents Chemother. 2008 Dec;52(12):4274-80. doi: 10.1128/AAC.00740-08. Epub 2008 Sep 22. Antimicrob Agents Chemother. 2008. PMID: 18809934 Free PMC article.
-
Identification of promoter elements responsible for the regulation of MDR1 from Candida albicans, a major facilitator transporter involved in azole resistance.Microbiology (Reading). 2006 Dec;152(Pt 12):3701-3722. doi: 10.1099/mic.0.29277-0. Microbiology (Reading). 2006. PMID: 17159223
-
Multiple cis-acting sequences mediate upregulation of the MDR1 efflux pump in a fluconazole-resistant clinical Candida albicans isolate.Antimicrob Agents Chemother. 2006 Jul;50(7):2300-8. doi: 10.1128/AAC.00196-06. Antimicrob Agents Chemother. 2006. PMID: 16801405 Free PMC article.
-
Transcriptional regulation of MDR1, encoding a drug efflux determinant, in fluconazole-resistant Candida albicans strains through an Mcm1p binding site.Eukaryot Cell. 2006 Dec;5(12):1957-68. doi: 10.1128/EC.00243-06. Epub 2006 Oct 13. Eukaryot Cell. 2006. PMID: 17041190 Free PMC article.
Cited by
-
SAGA/ADA complex subunit Ada2 is required for Cap1- but not Mrr1-mediated upregulation of the Candida albicans multidrug efflux pump MDR1.Antimicrob Agents Chemother. 2014 Sep;58(9):5102-10. doi: 10.1128/AAC.03065-14. Epub 2014 Jun 16. Antimicrob Agents Chemother. 2014. PMID: 24936593 Free PMC article.
-
cis-Acting elements within the Candida albicans ERG11 promoter mediate the azole response through transcription factor Upc2p.Eukaryot Cell. 2007 Dec;6(12):2231-9. doi: 10.1128/EC.00331-06. Epub 2007 Oct 19. Eukaryot Cell. 2007. PMID: 17951521 Free PMC article.
-
Tetracycline alters drug susceptibility in Candida albicans and other pathogenic fungi.Microbiology (Reading). 2008 Mar;154(Pt 3):960-970. doi: 10.1099/mic.0.2007/013805-0. Microbiology (Reading). 2008. PMID: 18310042 Free PMC article.
-
A multifunctional, synthetic Gaussia princeps luciferase reporter for live imaging of Candida albicans infections.Infect Immun. 2009 Nov;77(11):4847-58. doi: 10.1128/IAI.00223-09. Epub 2009 Aug 17. Infect Immun. 2009. PMID: 19687206 Free PMC article.
-
Gain-of-function mutations in the transcription factor MRR1 are responsible for overexpression of the MDR1 efflux pump in fluconazole-resistant Candida dubliniensis strains.Antimicrob Agents Chemother. 2008 Dec;52(12):4274-80. doi: 10.1128/AAC.00740-08. Epub 2008 Sep 22. Antimicrob Agents Chemother. 2008. PMID: 18809934 Free PMC article.
References
-
- Broco, N., S. Tenreiro, C. A. Viegas, and I. Sa Correia. 1999. FLR1 gene (ORF YBR008c) is required for benomyl and methotrexate resistance in Saccharomyces cerevisiae and its benomyl-induced expression is dependent on Pdr3 transcriptional regulator. Yeast 15:1595-1608. - PubMed
-
- Coleman, S. T., E. Tseng, and W. S. Moye-Rowley. 1997. Saccharomyces cerevisiae basic region-leucine zipper protein regulatory networks converge at the ATR1 structural gene. J. Biol. Chem. 272:23224-23230. - PubMed
Publication types
MeSH terms
Substances
Grants and funding
LinkOut - more resources
Full Text Sources
