

CisMols Analyzer: identification of compositionally similar cis-element clusters in ortholog conserved regions of coordinately expressed genes
- PMID: 15980500
- PMCID: PMC1160246
- DOI: 10.1093/nar/gki486
CisMols Analyzer: identification of compositionally similar cis-element clusters in ortholog conserved regions of coordinately expressed genes
Erratum in
- Nucleic Acids Res. 2005;33(13):4377
Abstract
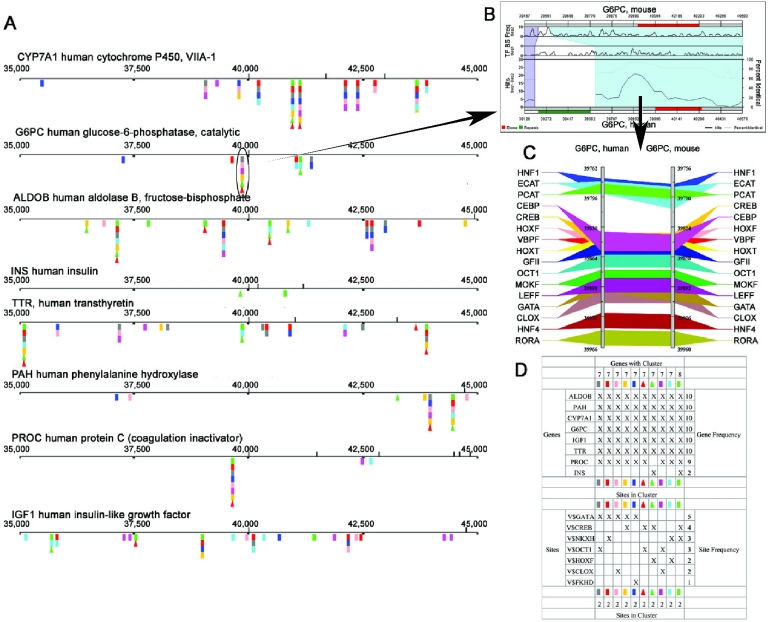
Combinatorial interactions of sequence-specific trans-acting factors with localized genomic cis-element clusters are the principal mechanism for regulating tissue-specific and developmental gene expression. With the emergence of expanding numbers of genome-wide expression analyses, the identification of the cis-elements responsible for specific patterns of transcriptional regulation represents a critical area of investigation. Computational methods for the identification of functional cis-regulatory modules are difficult to devise, principally because of the short length and degenerate nature of individual cis-element binding sites and the inherent complexity that is generated by combinatorial interactions within cis-clusters. Filtering candidate cis-element clusters based on phylogenetic conservation is helpful for an individual ortholog gene pair, but combining data from cis-conservation and coordinate expression across multiple genes is a more difficult problem. To approach this, we have extended an ortholog gene-pair database with additional analytical architecture to allow for the analysis and identification of maximal numbers of compositionally similar and phylogenetically conserved cis-regulatory element clusters from a list of user-selected genes. The system has been successfully tested with a series of functionally related and microarray profile-based co-expressed ortholog pairs of promoters and genes using known regulatory regions as training sets and co-expressed genes in the olfactory and immunohematologic systems as test sets. CisMols Analyzer is accessible via a Web interface at http://cismols.cchmc.org/.
Figures
Similar articles
-
GenomeTrafac: a whole genome resource for the detection of transcription factor binding site clusters associated with conventional and microRNA encoding genes conserved between mouse and human gene orthologs.Nucleic Acids Res. 2007 Jan;35(Database issue):D116-21. doi: 10.1093/nar/gkl1011. Epub 2006 Dec 18. Nucleic Acids Res. 2007. PMID: 17178752 Free PMC article.
-
Detection and visualization of compositionally similar cis-regulatory element clusters in orthologous and coordinately controlled genes.Genome Res. 2002 Sep;12(9):1408-17. doi: 10.1101/gr.255002. Genome Res. 2002. PMID: 12213778 Free PMC article.
-
CREME: Cis-Regulatory Module Explorer for the human genome.Nucleic Acids Res. 2004 Jul 1;32(Web Server issue):W253-6. doi: 10.1093/nar/gkh385. Nucleic Acids Res. 2004. PMID: 15215390 Free PMC article.
-
[Bio-database literacy and its application with cis-regulatory modules to find novel drug target proteins].Yakugaku Zasshi. 2008 Nov;128(11):1525-35. doi: 10.1248/yakushi.128.1525. Yakugaku Zasshi. 2008. PMID: 18981686 Review. Japanese.
-
In silico promoters: modelling of cis-regulatory context facilitates target predictio.J Cell Mol Med. 2009 Feb;13(2):270-8. doi: 10.1111/j.1582-4934.2008.00371.x. Epub 2008 May 24. J Cell Mol Med. 2009. PMID: 18505473 Free PMC article. Review.
Cited by
-
Dynamic SPR monitoring of yeast nuclear protein binding to a cis-regulatory element.Biochem Biophys Res Commun. 2007 Nov 9;363(1):153-8. doi: 10.1016/j.bbrc.2007.08.130. Epub 2007 Aug 30. Biochem Biophys Res Commun. 2007. PMID: 17850763 Free PMC article.
-
Identifying putative promoter regions of Hermansky-Pudlak syndrome genes by means of phylogenetic footprinting.Ann Hum Genet. 2009 Jul;73(Pt 4):422-8. doi: 10.1111/j.1469-1809.2009.00525.x. Ann Hum Genet. 2009. PMID: 19523149 Free PMC article.
-
Computational identification of transcriptional regulatory elements in DNA sequence.Nucleic Acids Res. 2006 Jul 19;34(12):3585-98. doi: 10.1093/nar/gkl372. Print 2006. Nucleic Acids Res. 2006. PMID: 16855295 Free PMC article. Review.
-
bZIPDB: a database of regulatory information for human bZIP transcription factors.BMC Genomics. 2007 May 30;8:136. doi: 10.1186/1471-2164-8-136. BMC Genomics. 2007. PMID: 17535445 Free PMC article.
-
Synthetic Promoters: Designing the cis Regulatory Modules for Controlled Gene Expression.Mol Biotechnol. 2018 Aug;60(8):608-620. doi: 10.1007/s12033-018-0089-0. Mol Biotechnol. 2018. PMID: 29855997 Review.
References
-
- Davidson E.H., Rast J.P., Oliveri P., Ransick A., Calestani C., Yuh C.H., Minokawa T., Amore G., Hinman V., Arenas-Mena C., et al. A genomic regulatory network for development. Science. 2002;295:1669–1678. - PubMed
-
- Arnone M.I., Davidson E.H. The hardwiring of development: organization and function of genomic regulatory systems. Development. 1997;124:1851–1864. - PubMed
-
- Lawrence C.E., Altschul S.F., Boguski M.S., Liu J.S., Neuwald A.F., Wootton J.C. Detecting subtle sequence signals: a Gibbs sampling strategy for multiple alignment. Science. 1993;262:208–214. - PubMed
-
- van Helden J., Andre B., Collado-Vides J. Extracting regulatory sites from the upstream region of yeast genes by computational analysis of oligonucleotide frequencies. J. Mol. Biol. 1998;281:827–842. - PubMed
Publication types
MeSH terms
Substances
Grants and funding
LinkOut - more resources
Full Text Sources
Other Literature Sources
