PromoterPlot: a graphical display of promoter similarities by pattern recognition
- PMID: 15980503
- PMCID: PMC1160174
- DOI: 10.1093/nar/gki413
PromoterPlot: a graphical display of promoter similarities by pattern recognition
Abstract
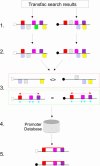
PromoterPlot (http://promoterplot.fmi.ch) is a web-based tool for simplifying the display and processing of transcription factor searches using either the commercial or free TransFac distributions. The input sequence is a TransFac search (public version) or FASTA/Affymetrix IDs (local install). It uses an intuitive pattern recognition algorithm for finding similarities between groups of promoters by dividing transcription factor predictions into conserved triplet models. To minimize the number of false-positive models, it can optionally exclude factors that are known to be unexpressed or inactive in the cells being studied based on microarray or proteomic expression data. The program will also estimate the likelihood of finding a pattern by chance based on the frequency observed in a control set of mammalian promoters we obtained from Genomatix. The results are stored as an interactive SVG web page on our server.
Figures


References
-
- Figeys D. Combining different ‘omics’ technologies to map and validate protein–protein interactions in humans. Brief. Funct. Genomic Proteomic. 2004;2:357–365. - PubMed
-
- Werner T. Models for prediction and recognition of eukaryotic promoters. Mamm. Genome. 1999;10:168–175. - PubMed
-
- Werner T. Finding and decrypting of promoters contributes to the elucidation of gene function. In Silico Biol. 2002;2:23. - PubMed
-
- Maruyama K., Sugano S. Oligo-capping: a simple method to replace the cap structure of eukaryotic mRNAs with oligoribonucleotides. Gene. 1994;138:171–174. - PubMed

