

T-profiler: scoring the activity of predefined groups of genes using gene expression data
- PMID: 15980543
- PMCID: PMC1160244
- DOI: 10.1093/nar/gki484
T-profiler: scoring the activity of predefined groups of genes using gene expression data
Abstract
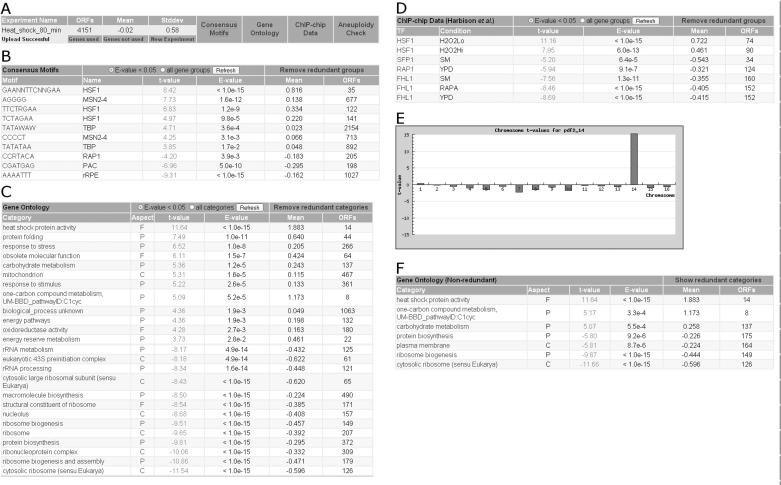
One of the key challenges in the analysis of gene expression data is how to relate the expression level of individual genes to the underlying transcriptional programs and cellular state. Here we describe T-profiler, a tool that uses the t-test to score changes in the average activity of predefined groups of genes. The gene groups are defined based on Gene Ontology categorization, ChIP-chip experiments, upstream matches to a consensus transcription factor binding motif or location on the same chromosome. If desired, an iterative procedure can be used to select a single, optimal representative from sets of overlapping gene groups. T-profiler makes it possible to interpret microarray data in a way that is both intuitive and statistically rigorous, without the need to combine experiments or choose parameters. Currently, gene expression data from Saccharomyces cerevisiae and Candida albicans are supported. Users can upload their microarray data for analysis on the web at http://www.t-profiler.org.
Figures
References
-
- Schena M., Shalon D., Davis R.W., Brown P.O. Quantitative monitoring of gene expression patterns with a complementary DNA microarray. Science. 1995;270:467–470. - PubMed
-
- Lockhart D.J., Dong H., Byrne M.C., Follettie M.T., Gallo M.V., Chee M.S., Mittmann M., Wang C., Kobayashi M., Horton H., et al. Expression monitoring by hybridization to high-density oligonucleotide arrays. Nat. Biotechnol. 1996;14:1675–1680. - PubMed
-
- Lee T.I., Rinaldi N.J., Robert F., Odom D.T., Bar-Joseph Z., Gerber G.K., Hannett N.M., Harbison C.T., Thompson C.M., Simon I., et al. Transcriptional regulatory networks in Saccharomyces cerevisiae. Science. 2002;298:799–804. - PubMed
Publication types
MeSH terms
Grants and funding
LinkOut - more resources
Full Text Sources
Other Literature Sources
Molecular Biology Databases
