

PathwayExplorer: web service for visualizing high-throughput expression data on biological pathways
- PMID: 15980551
- PMCID: PMC1160152
- DOI: 10.1093/nar/gki391
PathwayExplorer: web service for visualizing high-throughput expression data on biological pathways
Abstract
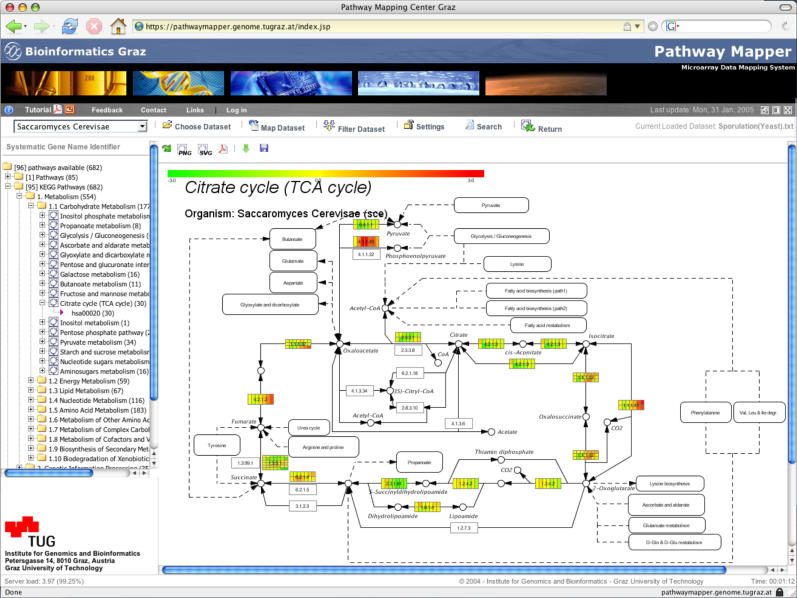
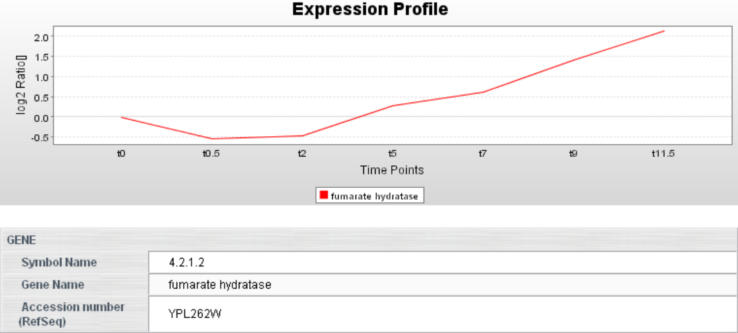
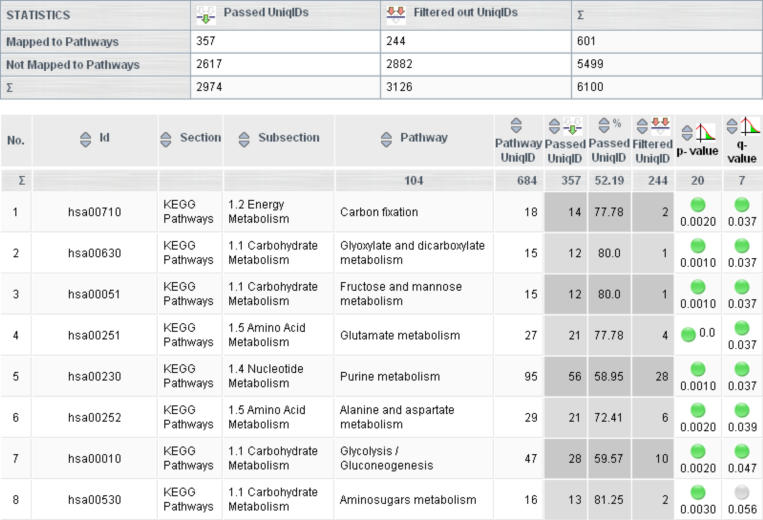
While generation of high-throughput expression data is becoming routine, the fast, easy, and systematic presentation and analysis of these data in a biological context is still an obstacle. To address this need, we have developed PathwayExplorer, which maps expression profiles of genes or proteins simultaneously onto major, currently available regulatory, metabolic and cellular pathways from KEGG, BioCarta and GenMAPP. PathwayExplorer is a platform-independent web server application with an optional standalone Java application using a SOAP (simple object access protocol) interface. Mapped pathways are ranked for the easy selection of the pathway of interest, displaying all available genes of this pathway with their expression profiles in a selectable and intuitive color code. Pathway maps produced can be downloaded as PNG, JPG or as high-resolution vector graphics SVG. The web service is freely available at https://pathwayexplorer.genome.tugraz.at; the standalone client can be downloaded at http://genome.tugraz.at.
Figures
Similar articles
-
ArrayXPath: mapping and visualizing microarray gene-expression data with integrated biological pathway resources using Scalable Vector Graphics.Nucleic Acids Res. 2004 Jul 1;32(Web Server issue):W460-4. doi: 10.1093/nar/gkh476. Nucleic Acids Res. 2004. PMID: 15215430 Free PMC article.
-
ArrayXPath II: mapping and visualizing microarray gene-expression data with biomedical ontologies and integrated biological pathway resources using Scalable Vector Graphics.Nucleic Acids Res. 2005 Jul 1;33(Web Server issue):W621-6. doi: 10.1093/nar/gki450. Nucleic Acids Res. 2005. PMID: 15980549 Free PMC article.
-
MARS: microarray analysis, retrieval, and storage system.BMC Bioinformatics. 2005 Apr 18;6:101. doi: 10.1186/1471-2105-6-101. BMC Bioinformatics. 2005. PMID: 15836795 Free PMC article.
-
CARMAweb: comprehensive R- and bioconductor-based web service for microarray data analysis.Nucleic Acids Res. 2006 Jul 1;34(Web Server issue):W498-503. doi: 10.1093/nar/gkl038. Nucleic Acids Res. 2006. PMID: 16845058 Free PMC article.
-
GeneCruiser: a web service for the annotation of microarray data.Bioinformatics. 2005 Sep 15;21(18):3681-2. doi: 10.1093/bioinformatics/bti587. Epub 2005 Jul 19. Bioinformatics. 2005. PMID: 16030072
Cited by
-
TiSGeD: a database for tissue-specific genes.Bioinformatics. 2010 May 1;26(9):1273-5. doi: 10.1093/bioinformatics/btq109. Epub 2010 Mar 11. Bioinformatics. 2010. PMID: 20223836 Free PMC article.
-
CoPub: a literature-based keyword enrichment tool for microarray data analysis.Nucleic Acids Res. 2008 Jul 1;36(Web Server issue):W406-10. doi: 10.1093/nar/gkn215. Epub 2008 Apr 28. Nucleic Acids Res. 2008. PMID: 18442992 Free PMC article.
-
Muscle wasting and the temporal gene expression pattern in a novel rat intensive care unit model.BMC Genomics. 2011 Dec 13;12:602. doi: 10.1186/1471-2164-12-602. BMC Genomics. 2011. PMID: 22165895 Free PMC article.
-
CoryneCenter - an online resource for the integrated analysis of corynebacterial genome and transcriptome data.BMC Syst Biol. 2007 Nov 22;1:55. doi: 10.1186/1752-0509-1-55. BMC Syst Biol. 2007. PMID: 18034885 Free PMC article.
-
SEAS: a system for SEED-based pathway enrichment analysis.PLoS One. 2011;6(7):e22556. doi: 10.1371/journal.pone.0022556. Epub 2011 Jul 22. PLoS One. 2011. PMID: 21799897 Free PMC article.
References
-
- Sturn A., Mlecnik B., Pieler R., Rainer J., Truskaller T., Trajanoski Z. Client-server environment for high-performance gene expression data analysis. Bioinformatics. 2003;19:772–773. - PubMed
