. 2005 Aug;6(8):785-92.
doi: 10.1038/ni1220. Epub 2005 Jun 26.

Nonstimulatory peptides contribute to antigen-induced CD8-T cell receptor interaction at the immunological synapse

Affiliations

Nonstimulatory peptides contribute to antigen-induced CD8-T cell receptor interaction at the immunological synapse

Pia P Yachi et al. Nat Immunol. 2005 Aug.

Abstract

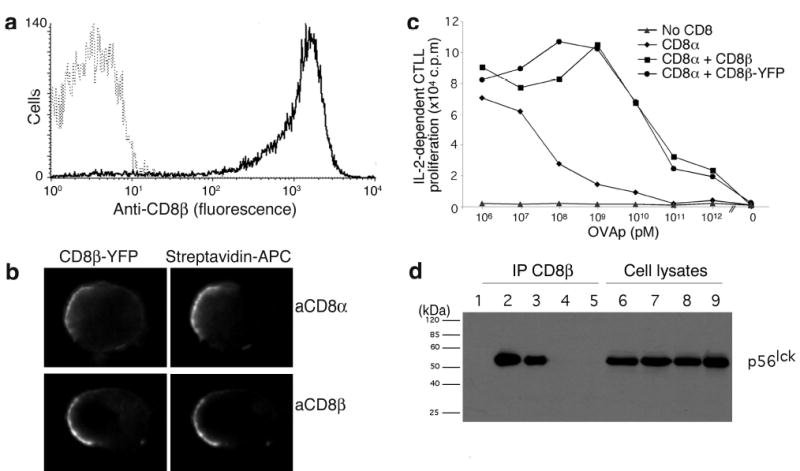
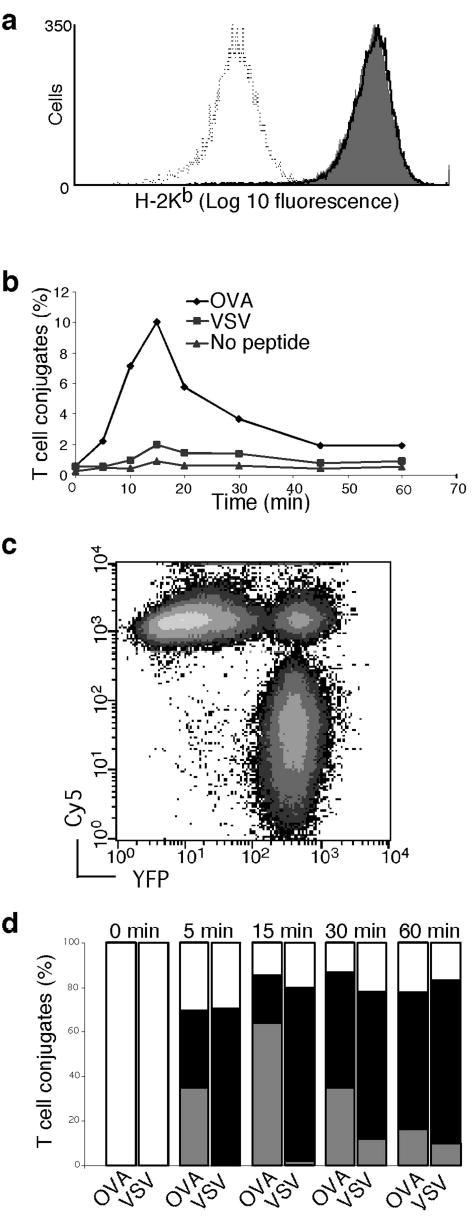
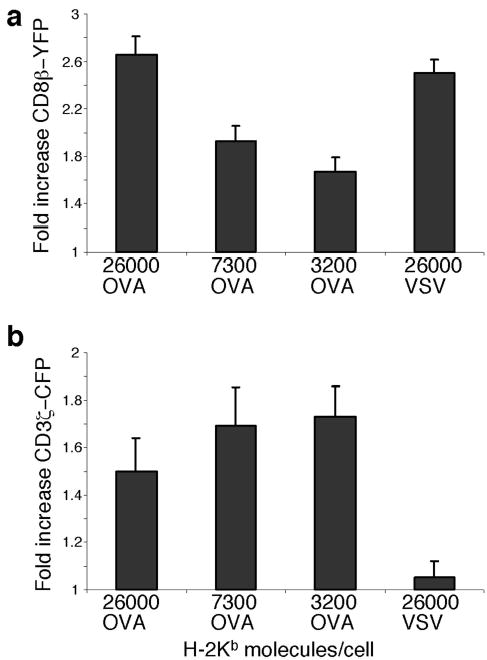
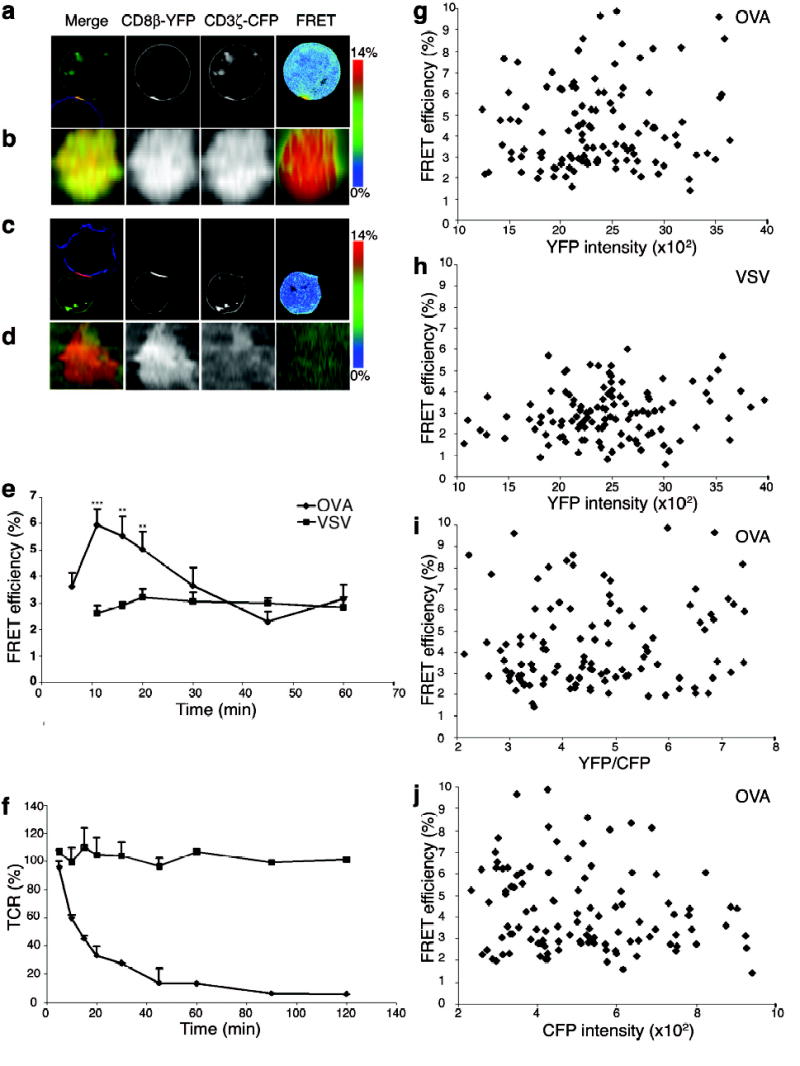
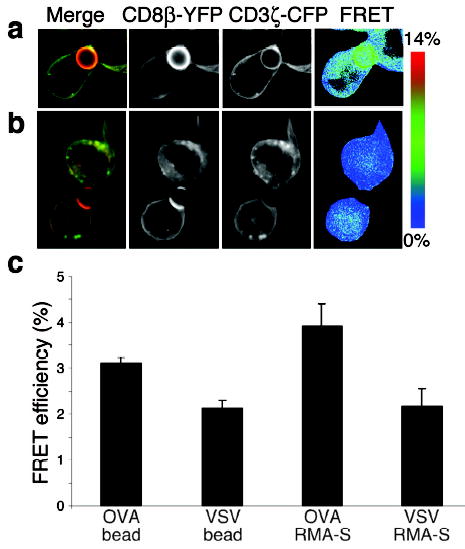
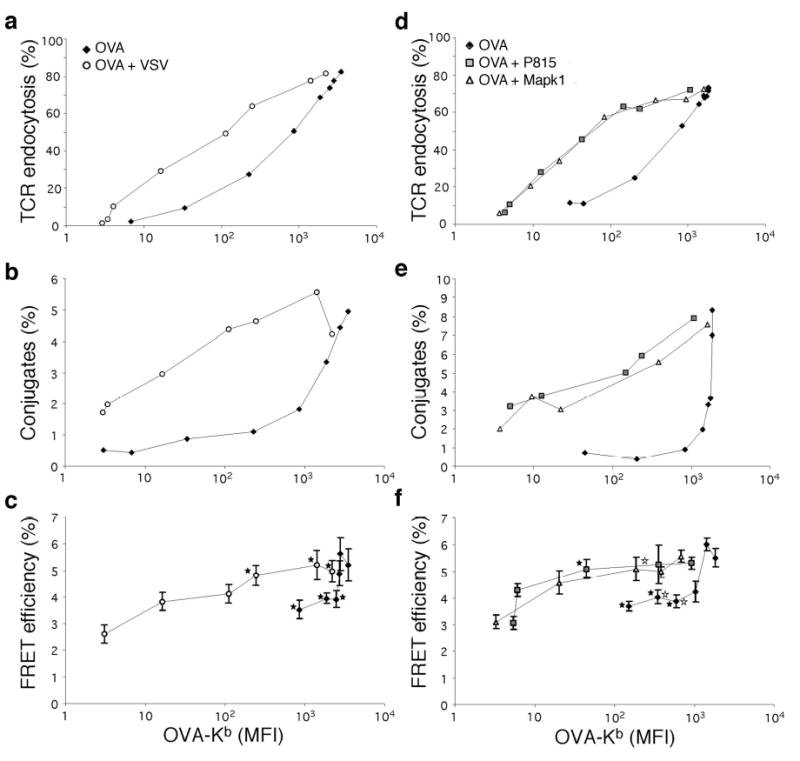
It is unclear if the interaction between CD8 and the T cell receptor (TCR)-CD3 complex is constitutive or antigen induced. Here, fluorescence resonance energy transfer microscopy between fluorescent chimeras of CD3zeta and CD8beta showed that this interaction was induced by antigen recognition in the immunological synapse. Nonstimulatory endogenous or exogenous peptides presented simultaneously with antigenic peptides increased the CD8-TCR interaction. This finding indicates that the interaction between the intracellular regions of a TCR-CD3 complex recognizing its cognate peptide-major histocompatibility complex (MHC) antigen, and CD8 (plus the kinase Lck), is enhanced by a noncognate CD8-MHC interaction. Thus, the interaction of CD8 with a nonstimulatory peptide-MHC complex helps mediate T cell recognition of antigen, improving the coreceptor function of CD8.


Conflict of interest statement

Competing interests statement

The authors declare that they have no competing financial interests.

Figures

Figure 1
Figure 1
Function of fluorescent chimeric proteins. (a) OT-I hybridomas with CD8α WT (broken line) or with CD8α WT + CD8β-YFP (solid line) were stained with anti-CD8β and analyzed by flow cytometry. (b) OT-I.ZC.8βY cells were stained with biotinylated anti-CD8α or -CD8β antibodies and crosslinked with streptavidin-allophycocyanin. (c) OT-I hybridomas lacking CD8 (▴), expressing CD8α WT (♦), CD8α WT + CD8β-YFP (•), or CD8α WT + CD8β WT (▪) were cultured with irradiated B6 splenocytes loaded with titrated amounts of OVA. (d) OT-I hybridomas lacking CD8 (lanes 5,9), with CD8α WT (lanes 4, 8), with CD8α WT + CD8β WT (lanes 3, 7) or with CD8α WT + CD8β-YFP (lanes 2, 6) were immunoprecipitated with anti-CD8β (lanes 1-5, lane 1 is anti-CD8β Ab alone), and analyzed together with cell lysates (lanes 6-9) by SDS-PAGE, immunoblotted with anti-Lck and detected with anti-MIgG-HRP. These data are representative of ≥3 experiments, except (d), performed twice.
Figure 2
Figure 2
T-APC conjugate formation and CD3ζ and CD8β recruitment to the synapse. (a) RMA-S cells were loaded with OVA (36 μM, grey fill) or VSV (80 μM, solid line) peptides, or no peptide (dotted line). These concentrations had previously been determined by titration to give equal H-2Kb density, as shown by anti-Kb Ab staining. (b) Time course of conjugate formation with antigen and non-stimulatory pMHC complexes. OT-I.ZC.8βY cells were allowed to interact with Cy5 labeled RMA-S cells expressing the same MHC density of either OVA or VSV peptide, or no peptide. At different time-points, cells were fixed and conjugate formation was assessed by flow cytometry. An example is shown in (c). Results are representative of three independent experiments. (d) Proportion of conjugates that had recruited CD8β-YFP or CD3ζ–CFP at different time-points. Conjugates were sorted by flow cytometry, visualized by microscopy, and randomized samples were categorized into three groups: increased CD8β-YFP and CD3ζ-CFP in synapse compared to the rest of the cell surface (gray bars), increased CD8β-YFP only (filled bars), or no increase in either protein (open bars). The 0 min timepoint represents cells prior to conjugate formation. The results are averages of 34<n<108 cells from 2 independent experiments. See also Supplementary Fig.1 online.
Figure 3
Figure 3
CD8 clustering to the synapse is MHC-driven whereas CD3ζ clustering is antigen driven. OT-I.ZC.8βY cells were allowed to interact with RMA-S cells expressing equivalent amounts of Kb-OVA or Kb-VSV complexes or different amounts of Kb-OVA. The number of pMHC molecules expressed by the RMA-S cells is indicated. OT-I.ZC.8βY cells were assessed for their fold increase in CD8β-YFP in the synapse (a) or fold increase in CD3ζ-CFP in the synapse (b), by comparing the fluorescence intensity in the contact area to that in the rest of the cell membrane. The results are shown as mean + SE, for n>10. In (a) p<0.05 between all the samples except for 26,000 OVA vs. 26,000 VSV and 7300 OVA vs. 3200 OVA. In (b) p< 0.05 between VSV vs. all of the OVA samples, but not between the different OVA samples. Results are representative of three independent experiments.
Figure 4
Figure 4
Agonist peptide induces co-localization and interaction between CD8β-YFP and CD3ζ-CFP. Live OT-I hybridomas expressing CD3ζ-CFP, CD8α WT plus CD8β-YFP (OT-I.ZC.8βY) were incubated with Cy5 stained APC loaded with OVA (a, b) or VSV (c, d). (a,c) mid-cell sections, (b,d) en face projections. Merged images (left) show CD8β-YFP (red), CD3ζ-CFP (green) and Cy5 (blue). FRET efficiency images are shown in the right column (see scale bar). Contact areas were defined in 3D by the T cell-APC fluorescence overlap. (e) OT-I.ZC.8βY cells were incubated with OVA or VSV loaded RMA-S cells for indicated times, fixed and average FRET efficiency + SE (18<n<38, except OVA 30 min n=13, VSV 20 min n=11, VSV 30 min n=15) was assessed from the synapse. *** p<0.00002; ** p<0.01 between OVA and VSV. For VSV there were too few 5 min T-APC conjugates to measure. (f) As (e): cell surface TCR was assessed with anti-Vβ5. (g-j) OT-I.ZC.8βY cells were incubated with OVA (g,i,j) or VSV (h) loaded RMA-S cells for 12 min and FRET efficiency was assessed from the synapses. (g,h) FRET efficiency versus YFP intensity, (i) FRET efficiency versus YFP/CFP ratio (The molar ratio= intensity ratio/2.2), (j) FRET efficiency versus CFP intensity.
Figure 5
Figure 5
Close molecular proximity of CD8β and CD3ζ can be induced by pMHC molecules alone. OT-I.ZC.8βY cells were incubated with Kb-OVA coated beads (a) or Kb-VSV coated beads (b). The beads are not themselves fluorescent. Kb-OVA induced the recruitment of both CD8β-YFP and, to a lesser extent, CD3ζ-CFP (a), whereas Kb-VSV allowed only the recruitment of CD8β-YFP to the contact interface with the bead (b). The cells almost engulf the beads, as seen previously. The FRET signal was specifically induced at the interface with Kb-OVA beads but not with Kb-VSV beads. (c) statistics of fixed cells are shown. The results are shown as average FRET efficiency + SE (n=36 for OVA coated beads, n=36 for VSV coated beads, n=19 for OVA RMA-S and n=10 for VSV RMA-S). p=2.7 x 10⁻⁶ between OVA and VSV beads, p=0.032 between OVA beads and VSV RMA-S, and p=0.123 between OVA beads and OVA RMA-S.
Figure 6
Figure 6
Non-stimulatory peptides increase antigen induced interaction between CD8 and TCR. RMA-S cells were loaded with different amounts of OVA (♦), OVA+VSV (○), OVA+P815 (□), or OVA+Mapk1 (Δ). The amount of Kb-OVA was determined using anti-Kb-OVA Ab 25-D1.16 (x-axis). The total number of Kb molecules for the OVA-only group was estimated from staining with PE labeled anti-Kb (AF6-88.5), as in Fig.3. 26,000 Kb molecules corresponds to 3515 MFI on the Kb-OVA scale, 7300 Kb to 987 MFI and 3200 Kb to 433 MFI. OVA+VSV, +P815 or +Mapk1-loaded RMA-S cells all expressed ~26,000 Kb molecules. (a,d) OT-I.ZC.8βY cells were incubated with OVA or OVA+VSV, +P815 or +Mapk1 loaded RMA-S cells for 1h and stained with anti-Vβ5. (b,e) OT-I.ZC.8βY cells were incubated with Cy5 labeled RMA-S cells for 12 min, fixed and conjugate formation assessed by flow cytometry. (c,f) FRET efficiency was assessed from synapses. Results are shown as average FRET efficiency +SE (17<n<96 (c), 12<n<48 (f), naverage=30). ★ FRET efficiency values significantly different between OVA and OVA+VSV groups (c), or between OVA and OVA+P815 groups (f). ⋆ significantly different between OVA and OVA+Mapk1 groups (f). (For clarity, not all significant differences are marked).

Similar articles

Cited by

References

    1. Davis MM, et al. Ligand recognition by αβ T cell receptors. Annu Rev Immunol. 1998;16:523–534. - PubMed
    1. Gascoigne NRJ, Zal T, Alam SM. T-cell receptor binding kinetics in T-cell development and activation. Exp Rev Mol Med. 2001 Feb 12;2001:1–17. ( http://www.expertreviews.org/01002502h.htm) - PubMed
    1. Zamoyska R. CD4 and CD8: Modulators of T-cell receptor recognition of antigen and of immune responses? Curr Opin Immunol. 1998;10:82–87. - PubMed
    1. Potter TA, Rajan TV, Dick RF, 2nd, Bluestone JA. Substitution at residue 227 of H-2 class I molecules abrogates recognition by CD8-dependent, but not CD8-independent, cytotoxic T lymphocytes. Nature. 1989;337:73–75. - PubMed
    1. Madrenas J, Chau LA, Smith J, Bluestone JA, Germain RN. The efficiency of CD4 recruitment to ligand-engaged TCR controls the agonist/partial agonist properties of peptide-MHC molecule ligands. J Exp Med. 1997;185:219–229. - PMC - PubMed

Publication types

MeSH terms