. 2005 Jan;203(2):65-82.
doi: 10.1007/s00232-004-0732-5.

Novel properties of a mouse gamma-aminobutyric acid transporter (GAT4)

Affiliations

Novel properties of a mouse gamma-aminobutyric acid transporter (GAT4)

M H Karakossian et al. J Membr Biol. 2005 Jan.

Abstract

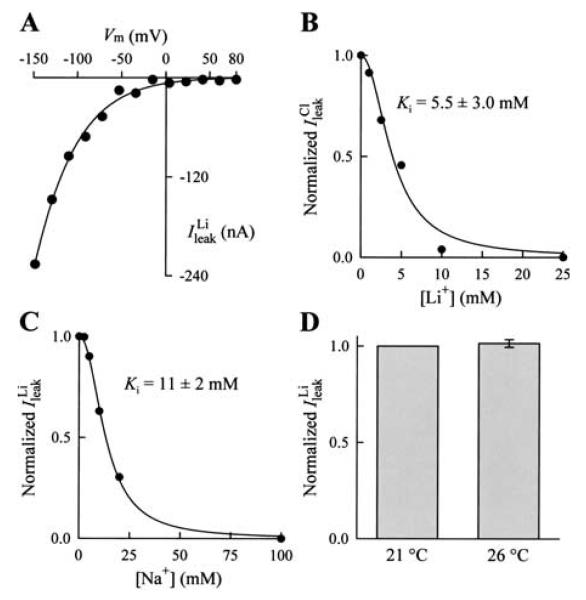
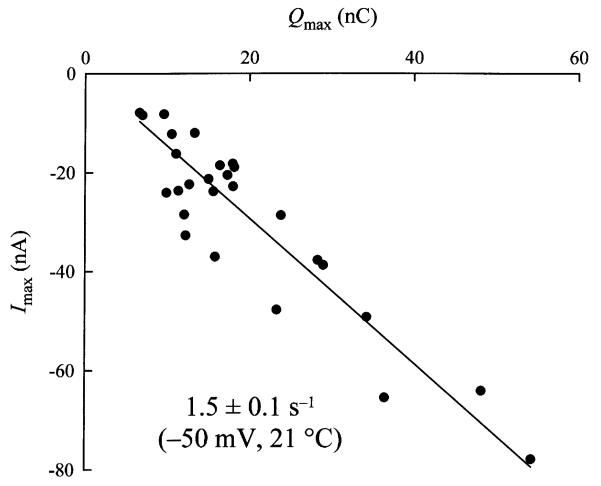
We expressed the mouse gamma-aminobutyric acid (GABA) transporter GAT4 (homologous to rat/ human GAT-3) in Xenopus laevis oocytes and examined its functional and pharmacological properties by using electrophysiological and tracer uptake methods. In the coupled mode of transport (Na+/ Cl-/GABA cotransport), there was tight coupling between charge flux and GABA flux across the plasma membrane (2 charges/GABA). Transport was highly temperature-dependent with a temperature coefficient (Q10) of 4.3. The GAT4 turnover rate (1.5 s(-l); -50 mV, 21 degrees C) and temperature dependence suggest physiological turnover rates of 15-20 s(-1). No uncoupled current was observed in the presence of Na+. In the absence of external Na+, GAT4 exhibited two distinct uncoupled currents. (i) A Cl- leak current (ICl(leak)) was observed when Na+ was replaced with choline or tetraethylammonium. The reversal potential of (ICl(leak)) followed the Cl- Nernst potential. (ii) A Li+ leak current (ILi(leak)) was observed when Na+ was replaced with Li+. Both leak currents were inhibited by Na+, and both were temperature-independent (Q10 approximately 1). The two leak modes appeared not to coexist, as Li+ inhibited (ICl(leak)). The results suggest the existence of cation- and anion-selective channel-like pathways in GAT4. Flufenamic acid inhibited GAT4 Na+/Cl-/GABA cotransport, ILi(leak), and ICl(leak), (Ki approximately 30 microM), and the voltage-induced presteady-state charge movements (Ki approximately 440 microM). Flufenamic acid exhibited little or no selectivity for GAT1, GAT2, or GAT3. Sodium and GABA concentration jicroumps revealed that slow Na+ binding to the transporter is followed by rapid GABA-induced translocation of the ligands across the plasma membrane. Thus, Na+ binding and associated conformational changes constitute the rate-limiting steps in the transport cycle.


Figures

Fig. 1
Fig. 1. General steady-state properties of GAT4
(A) GABA up-take (200 μm) into GAT4-expressing oocytes was strictly dependent on external Na+, however, external Cl was not absolutely required. The data for each bar represent the mean ± se from at least 30 control or GAT4-expressing cells. Similar results were obtained with cells from four donor frogs. (B) In GAT4-expressing cells, GABA evoked an inward current that was absent in control cells (Vm = −50 mV). (C) The total charge translocated across the plasma membrane (i.e., time integral of the GABA-evoked inward current) was directly proportional to GABA uptake. The solution contained 200 μm GABA and 30 μm [3H]-GABA. The ratio of net inward charge to GABA uptake obtained in the same cells was 2.1 ± 0.1 charges/GABA (N = 16). Vm was −50 mV. (D) Similar to GABA uptake, the GABA-induced (200 μm) inward current was strictly dependent on external Na+, but only partially dependent on external Cl. The current-voltage relationship (taken as the difference between values in the presence and absence of GABA) did not saturate at hyperpolarized potentials and approached zero at depolarized potentials.
Fig. 2
Fig. 2. Steady-state kinetic parameters
(A) The GABA-evoked inward current was saturable with a half-maximal concentration (K0.5GABA) of 8.1 ± 1.0 μm (100 mm [Na+]o, 106 mm [Cl]o) (N = 3). (B) The Na+dependence of the GABA-evoked (500 μm GABA, 106 mm [Cl]o) current followed a sigmoidal relationship with a Hill coefficient of 2.4 ± 0.1 (N = 4). The half-maximal Na+ concentration (K0.5Na+) was 61 ± 2 mm (N = 3). (C) In the absence of external Cl, the current was reduced by ≈75%. Cl enhancement of the GABA-evoked (500 μm GABA, 100 mm [Na+]o) current followed sigmoidal kinetics. The Cl concentration required for half-maximal enhancement of the GABA-evoked current was 32 ± 2 mm (N = 4). The Hill coefficient for Cl enhancement was 2.0 ± 0.2 (N = 4). The reported values in panels A–C are for Vm = −50 mV. The lines in panels A–C represent the fit of the data to Equation 1. In panel C, an additional linear term was added to account for the non-zero baseline at zero Cl concentration.
Fig. 3
Fig. 3. GAT4 Na+/Cl/GABA cotransport is highly temperature-dependent
(A) GABA-evoked current traces were recorded at 21 (left panel) and 31°C(right panel) from an oocyte expressing GAT4 ([GABA] = 200 μm; Vm = −50 mV). There was a > 4-fold increase in the GABA-evoked current as the temperature was raised by 10°C. Q10 (21–31°C) was 4.3 ± 0.2 (N = 8). (B) Arrhenius plot for the temperature dependence of GABA-evoked Imax (Vm = −50 mV). The temperature of the bath was varied between 16.2 and 31°C. The GABA concentration used (200 μm) was saturating at all temperatures. The line is a linear regression through the data points. The activation energy (Ea) was determined from the slope of the line (Ea = −slope × R, where R is the gas constant). Ea was 29 ± 1 kcal/mol (N = 5).
Fig. 4
Fig. 4
GAT4 exhibits a Na+-inhibited Cl leak conductance. (A) In cells expressing GAT4, removal of Na+ from the bath (choline or TEA replacement) led to an inward current (middle trace) (Vm = −60 mV). The current was present in the absence of GABA and was not altered by addition of GABA. Therefore, the current represents an uncoupled (or leak) mode of the transporter. This leak current is carried by Cl ions and, thus, it is referred to as IleakCl. IleakCl was not observed in control cells or hGAT1-expressing cells (left and right traces). (B) When examined in the same cells, IleakCl was directly proportional to the GABA-evoked inward current (INaClGABA). At −60 mV,IleakCl was 55 ± 4% of INaClGABA (N = 29). (C) IleakCl reversed at the calculated Cl equilibrium potential. The current-voltage relationship (−150 to + 80 mV) was obtained by subtracting current values in the presence of NaCl from corresponding values in the presence of choline-Cl. Similar I-V relationships were obtained when values in the presence of choline-Cl and flufenamic acid (500 μm) were subtracted from those obtained in the presence of choline-Cl (see Fig. 6). The reversal potential (Vrev) for IleakCl closely followed the predicted Cl Nernst potential (VCl); the slope was 56 ± 3 mV/decade (N = 4). (D) Na+ led to a concentration-dependent inhibition of IleakCl; the Na+ concentration for 50% inhibition was 28 ± 2 mm, and the Hill coefficient was 3.0 ± 0.2 (N = 4) (Vm = −80 mV). (E) IleakCl was temperature-independent. The Q10 (21–26°C) was 1.03 ± 0.01 (N = 3). The measurements were taken at Vm = −80 mV.
Fig. 5
Fig. 5
GAT4 exhibits a Na+-inhibited Li+ leak conductance. (A) In cells expressing GAT4, replacement of external Na+ with Li+ caused a Li+ leak current. This current will be referred to as IleakLi The current-voltage relationship (−150 to + 80 mV) was obtained by subtracting current values in the presence of NaCl from corresponding values in the presence of LiCl. The Li+ leak current was most pronounced at hyperpolarized potentials, and approached zero at depolarized potentials. (B) Li+ inhibited the Cl leak current (IleakCl) in a concentration-dependent manner. At +80 mV (a voltage at which no IleakLi is present; see panel A), the Li+ concentration for 50% inhibition of IleakCl was 5.5 ± 3.0 mm, and the Hill coefficient was 1.5 ± 0.2 (N = 4). (C)Na+ led to a concentration-dependent inhibition of IleakLi. The Na+ leak concentration for 50% inhibition of IleakLi was 11 ± 2 mm, and the Hill coefficient was 1.8 ± 0.3 (N = 3) (Vm = −80 mV). (D) IleakLi was temperature independent. The Q10 (21–26°C) was 1.01 ± 0.03 (N = 4). The measurements were taken at Vm = −80 mV.
Fig. 6
Fig. 6
Isoform-specific inhibition of GAT4 by flufenamic acid. (A) Application of flufenamic acid (500 μm) to GAT4-expressing cells did not alter the holding current (left trace)(Vm = −60 mV). When applied in the presence of GABA, however, flufenamic acid led to the inhibition of GAT4 Na+/Cl/GABA cotransport across the plasma membrane (right trace). (B) The flufenamic acid concentration for 50% inhibition of the GABA-evoked current (INaClGABA) was 29 ± 7 μm (N = 5). [GABA] was 200 μm. (C and D) flufe-namic acid also inhibited IleakCl (Ki = 30 ± 2 μm; N = 3) (C) and IleakLi (Ki = 23 ± 6 μm; N = 3) (D). (E) Flufenamic acid (500 μm) inhibited only GAT4-mediated [3H]-GABA uptake, and had no significant effect on GABA transport mediated by hGAT1, mGAT2, mGAT3, or a chimeric GAT3/4 protein (P > 0.1). The data for each bar represent the mean ± SE from ≥15 cells. Similar results were obtained with cells from three donor frogs. Inset shows the predicted topology of the chimeric mGAT3/4 protein, in which the black region corresponds to the amino half of mGAT3, and the gray region corresponds to the carboxy half of mGAT4 (see Materials and Methods).
Fig. 7
Fig. 7
Presteady-state charge movements of GAT4. (A) Step changes in the membrane potential of GAT4-expressing cells evoked presteady-state current transients. The holding potential was −50 mV, and the voltage pulses (400 ms) ranged from +80 mV to −70 mV in 10-mV steps. These transients were not observed in control cells (not shown). Notice that the OFF transients relaxed very slowly to a steady-state (see text and Fig. 8). (B) The charge movements were isolated after subtraction of the records in the absence of Na+ (choline replacement) (Sacher et al., 2002). (C) At each applied voltage, time integration of the ON transients in panel B yielded the charge moved. The charge-voltage (Q-V) relationship obtained was fitted to a single Boltzmann function (Eq. 3). The parameters obtained from the fit were: V0.5, 18 ± 1 mV and , 1.8 ± 0.1 (N = 26). The maximum charge (Qmax) depended on GAT4 expression at the cell surface (see Fig. 10). (D) The GAT4 ON transients exhibited mono-exponential relaxation. The time constant of the relaxation (τON) as a function of the test voltage (τON-V relationship) followed a bell-shaped function. The voltage at maximum τON was 21 ± 3 mV (N = 26). This voltage is similar to the V0.5 of the Q-V relationship (panel C). The line is the fit of the data to a bell-shaped function (see Sacher et al., 2002).
Fig. 8
Fig. 8
Slow relaxation of presteady-state OFF transients. (A) Two pulses (400 ms; −50 mV to +80 mV) were applied in succession with a defined interpulse interval, and the resulting current traces were superimposed. As the interpulse interval was shortened, the presteady-state charge movements became smaller. Notice that for very short interpulse intervals, when the second pulse was applied, the OFF transients had not yet decayed back to the holding level (arrowheads). The dashed line represents the baseline holding current. For each trace, the presteady-state charge movements were extracted from the total current trace, and the charge moved was quantified (see panel B). (B) Two pulses were applied in succession (as in panel A) while the interpulse interval was varied. The charge moved in response to the second pulse (Q2) was normalized with respect to that moved in response to the first pulse (Q1). Charge recovery (Q2/Q1) plotted as function of the interpulse interval followed a single rising exponential function with a time constant (τrecovery) of 516 ± 65 ms (N = 4). (C) Double-pulses were applied from a holding voltage of −50 mV to test voltages ranging from 0 to 80 mV, and the interpulse interval was varied in order to determine τrecovery (as shown in panel B). τrecovery was independent of the test voltage.
Fig. 9
Fig. 9
Activation and inhibition of the presteady-state charge movements by ligands and inhibitor. (A–D) Qmax was quantified in the presence of increasing concentrations of the indicated ligands, and normalized (Qnorm) with respect to that obtained at 100 mm Na+, 106 mm Cl, and in the absence of GABA or inhibitor. The presteady-state charge movements were activated by Na+ (K0.5 = 50 ± 2 mm; N = 3), enhanced by Cl (K0·5 ≥ 100 mm; N = 4), and inhibited by GABA (Ki = 7 ± 1 μm; N = 3) and flufenamic acid (Ki = 442 ± 30 μm; N = 3). In panel A, [Cl] was held constant at 106 mm. In panel B, [Na+] was held constant at 100 mm. In panels C and D, [Na+] was 100 mm, and [Cl] was 106 mm.
Fig. 10
Fig. 10
Steady-state turnover rate of GAT4. The turnover rate (RTO) of GAT4 was estimated according to RTO = Imax/Qmax. In a group of GAT4-expressing cells, both Qmax (see Fig. 7) and Imax (at 1 mm GABA) were measured. At −50 mV and 21°C, the GAT4 turnover rate was 1.5 ± 0.1 s−1 (N = 27). Each data point corresponds to Qmax and Imax measurements from a single oocyte.
Fig. 11
Fig. 11
Concentration jumps at GAT4. (A) A representative GABA concentration jump is shown (Vm = −50 mV and [GABA] = 1 mm). An oocyte expressing GAT4 was stabilized in the NaCl buffer and GABA was rapidly introduced into the bath. The GABA-evoked inward current exhibited three distinct phases; (i) a rapid transient current (arrow at 1 and expanded in inset 1), (ii) a slow transient phase (arrow at 2 and expanded in inset 2), and (iii) a steady-state current (arrow at 3). For the rapid transient phase, the time-to-peak was 20 ± 2 ms, and its decay had a time constant of 15 ± 2 ms (N = 6). The slow transient phase exhibited mono-exponential decay to a steady state with a time constant of 1.3 ± 0.1 s (N = 6). The rapid and slow transient currents are absent in the conventional two-electrode voltage-clamp records shown in Figs. 1, 3, 4, and 6. Only the steady-state current is observed in conventional two-electrode voltage-clamp records. Upon rapid removal of GABA, the GABA-evoked current exhibited mono-exponential decay (arrow at 4) back to the baseline with a time constant of 12.0 ± 0.6 s (N = 6). (B) The oocyte was stabilized in a Na+-free buffer (equimolar replacement of NaCl with TEA-Cl), followed by rapid introduction of Na+ (100 mm) and GABA (1 mm) into the bath. The evoked current followed single exponential growth to a steady state with a time constant of 602 ± 76 ms (N = 6). Upon removal of Na+ and GABA, the evoked current decayed back to the baseline with a time constant of 645 ± 34 ms (N = 6).
Fig. 12
Fig. 12
Kinetic scheme of GAT4 transport cycle. Kinetic representation of the minimal steps required to describe GABA transporter function (Nelson, 1998; Hilgemann & Lu, 1999; Sacher et al., 2002). C denotes carrier; Na, Na+; Cl, Cl; and G, GABA. The subscripts “o” and “i” refer to the outward- and inward-facing carrier binding sites. (A) Clockwise transitions of the entire transport cycle result in forward Na+/Cl/GABA cotransport into the cell. (B–D) Voltage-induced charge movements are seen upon application of voltage pulses in the presence of Na+ (B), they are enhanced by Cl (C), and they are completely abolished by saturating concentrations of GABA (D) or inhibitor. The shaded regions in panels B and C represent the transitions that are thought to be induced by voltage pulses, and likely are responsible for the presteady-state charge movements (counter-clockwise transitions). By enhancing the maximum charge moved, Cl appears to stabilize the Na+-loaded state of the transporter (see text and Sacher et al., 2002). (D) Binding of GABA to the Na+- and Cl-loaded carrier induces rapid conformational changes that result in introduction of net charge into the cytoplasm (shaded steps enclosed by dashed line panel D). The shaded steps in panel D (clockwise transitions) may be responsible for the rapid transient observed with GABA concentration jumps (Fig. 11A). The rate-limiting steps for the entire transport cycle appear to be those shaded in panel B (clockwise transitions). See text for additional details.

Similar articles

Cited by

References

    1. Binda F, Bossi E, Giovannardi S, Forlani G, Peres A. Temperature effects on the presteady-state and transport-associated currents of GABA cotransporter rGAT1. FEBS Lett. 2002;512:303–307. - PubMed
    1. Bismuth Y, Kavanaugh MP, Kanner BI. Tyrosine 140 of the γ-aminobutyric acid transporter GAT–1 plays a critical role in neurotransmitter recognition. J. Biol. Chem. 1997;272:16096–16102. - PubMed
    1. Borden LA. GABA transporter heterogeneity: Pharmacology and cellular localization. Neurochem. Int. 1996;29:335–356. - PubMed
    1. Borden LA, Dhar TG, Smith K, Branchek TA, Gluchowshi C, Weinshank R. Cloning of the human homologue of the GABA transporter GAT-3 and identification of a novel inhibitor with selectivity for this site. Receptors Channels. 1994;2:207–312. - PubMed
    1. Cammack JN, Rakhilin SV, Schwartz EA. A GABA transporter operates asymmetrically and with variable stoichiometry. Neuron. 1994;13:949–960. - PubMed

Publication types

LinkOut - more resources