. 2005 Jul 4;202(1):21-31.
doi: 10.1084/jem.20050146. Epub 2005 Jun 27.

A multipotent precursor in the thymus maps to the branching point of the T versus B lineage decision

Affiliations

A multipotent precursor in the thymus maps to the branching point of the T versus B lineage decision

Claudia Benz et al. J Exp Med. .

Abstract

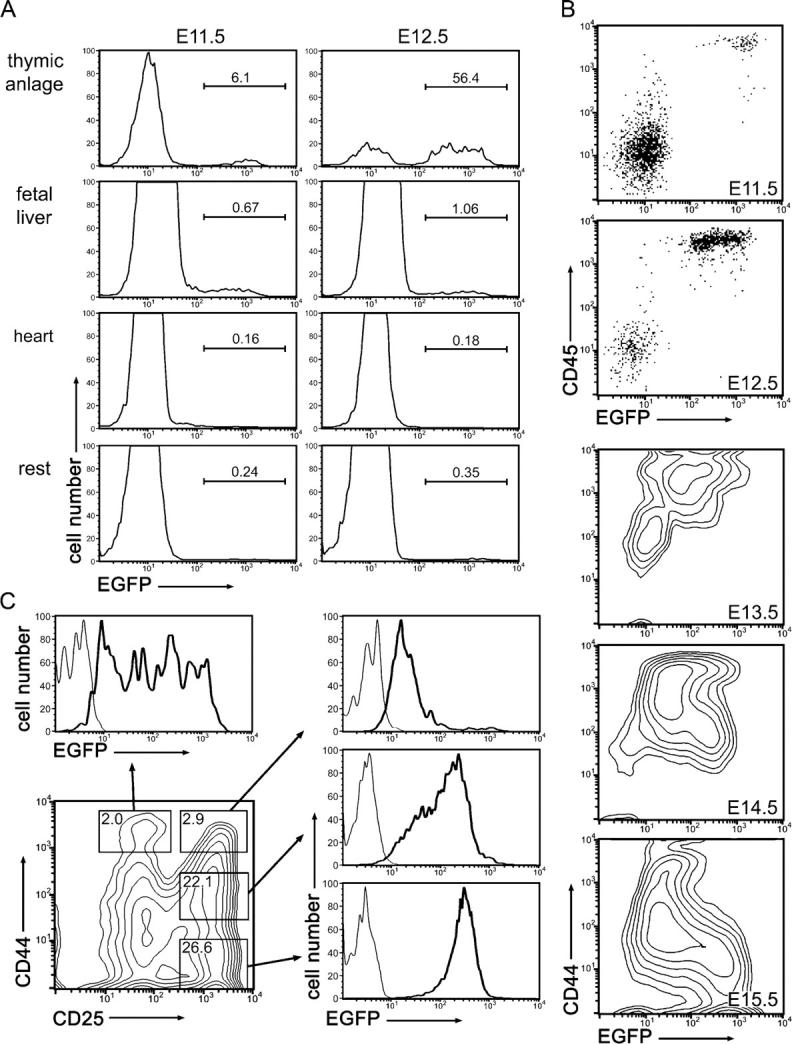
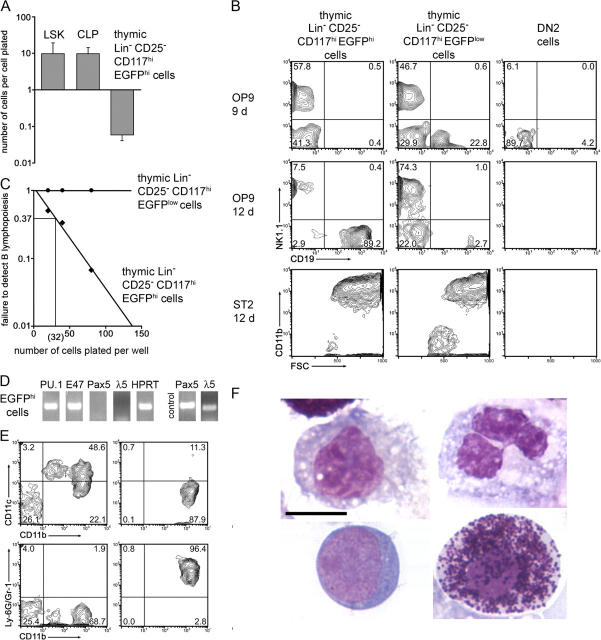
Hematopoietic precursors continuously colonize the thymus where they give rise mainly to T cells, but also to B and dendritic cells. The lineage relationship between these three cell types is unclear, and it remains to be determined if precursors in the thymus are multipotent, oligopotent, or lineage restricted. Resolution of this question necessitates the determination of the clonal differentiation potential of the most immature precursors in the thymus. Using a CC chemokine receptor 9-enhanced green fluorescent protein knock-in allele like a surface marker of unknown function, we identify a multipotent precursor present in bone marrow, blood, and thymus. Single cells of this precursor give rise to T, B, and dendritic cells. A more differentiated stage of this multipotent precursor in the thymus has lost the capacity to generate B but not T, dendritic, and myeloid cells. Thus, the newly identified precursor maps to the branching point of the T versus B lineage decision in the hematopoietic lineage hierarchy.


Figures

Figure 1.
Figure 1.
EGFPCCR9 expression of early stages of thymopoiesis in heterozygous CCR9-EGFP knock-in embryos. (A) Identification of EGFPCCR9-expressing cells in embryonic organs at E11.5 and E12.5 was done by analyzing single cell suspensions of the respective tissues by flow cytometry. The third pharyngeal pouch containing the thymic anlage was analyzed at E11.5. The percentage of EGFPCCR9-positive cells is indicated. Cell numbers are plotted as total number of cells. (B) Flow cytometric analysis of the earliest immigrants to the embryonic thymic anlage of heterozygous CCR9-EGFP knock-in embryos was performed for embryonic days 11.5 through 15.5. To avoid contaminating mature cells that were derived from the peripheral blood, the dot plots for E11.5 and E12.5 are gated on lymphoid cells negative for markers of lineage differentiation, including B220, CD3ɛ, CD4, CD8, CD11b, Gr-1, Ter119, TCRγδ, and NK1.1. Contour plots for E13.5, E14.5, and E15.5 are gated on all lymphoid cells. Note that the dot plots for E11.5 and E12.5 show stainings using anti-CD45 and the contour plots for E13.5, E14.5 and E15.5 show stainings using anti-CD44. (C) EGFPCCR9 expression was analyzed in immature stages of adult T cell development. The contour plot shows DN stage thymocytes after electronic exclusion of cells expressing markers of lineage differentiation as in the E11.5 and E12.5 plots in (B). Histogram plots for DN1(CD44+CD25), DN2(CD44+CD25+), intermediate DN2/DN3(CD44lowCD25+), and DN3(CD44CD25+) stage thymocytes of heterozygous CCR9-EGFP knock-in (thick line) and wild-type (thin line) mice are shown. Cell numbers are plotted relative to the channel with the highest number of cells.
Figure 2.
Figure 2.
Phenotypic and functional analysis of thymic progenitors found in bone marrow, peripheral blood and thymus of heterozygous CCR9-EGFP knock-in mice. (A) LinCD25CD117+EGFPCCR9+ cells found in bone marrow, peripheral blood, and thymus were analyzed for their expression of CD127(IL-7Rα), Sca-1, CD4, CD90.2, and CD44. Contour plots are gated for lymphoid cells negative for B220, CD3ɛ, CD8, CD25, CD11b, Gr-1, Ter119, TCRβ, TCRγδ, and NK1.1 and histogram plots below show the cells in the indicated gates for each compartment. Cell numbers are plotted relative to the channel with the highest number of cells. (B) A five-color flow cytometric analysis of LinCD25CD117+EGFPCCR9+ bone marrow cells is shown in two color-coded contour plots. Both contour plots are gated on lineage marker–negative bone marrow cells, and the location of LinCD25CD117+EGFPCCR9+ cells is shown in blue. Within this population the LinCD25CD117+EGFPCCR9+CD127-/low bone marrow cells are shown in green, and the LinCD25CD117+EGFPCCR9+CD127+ cells are shown in red. Lineage markers were defined as in (A). (C) 400 LinCD25CD117+EGFPCCR9+ cells isolated from the peripheral blood of heterozygous CCR9-EGFP knock-in mice were FACS sorted as indicated in (A), and intrathymically injected into sublethally irradiated C57BL/6 mice. The contour plot shows the analysis of EGFP-positive thymocytes 19 d after intrathymic transfer. (D) 100 EGFPCCR9+ bone marrow LSKs, 100 EGFPCCR9+LinCD25CD117+ blood cells, 100 EGFPCCR9+ thymic LSKs, and their respective EGFPCCR9− counterparts were cultured on OP9-DL1 stroma cells for 12 d. Histogram plots are gated on CD19NK1.1CD90.2+ cells. The results of two independent experiments are shown for each population.
Figure 3.
Figure 3.
Kinetics of early T cell development in FTOC cultures of LinCD25CD117+EGFPCCR9+ thymic precursors isolated from bone marrow, peripheral blood, and thymus. (A) 1,000 cells of the indicated phenotypes were FACS sorted from bone marrow and thymus as shown in Figs. 2 A and 3 B, and cultured together with a dGuo-treated E15.5 fetal thymic lobe. Cultures seeded with peripheral blood LinCD25CD117+EGFPCCR9+ cells were sorted as shown in Fig. 2 A and were initiated with 400–800 cells per lobe. FTOCs were analyzed at the indicated time points. Contour plots are gated on Lin lymphoid cells and histogram plots are gated on LinCD25+ lymphoid cells. The results of three independent experiments for each subset and time point are shown. The median channel of EGFP fluorescence averaged over the three shown experiments is indicated. Coreceptor double-positive cells were found consistently in these cultures after 16 d. (B) The gates used for FACS sorting of thymic LinCD25CD117hiEGFPCCR9hi and LinCD25CD117hiEGFPCCR9low cells that were isolated for the FTOC experiments shown in (A) are indicated. The contour plot was defined as in Fig. 2 A.
Figure 4.
Figure 4.
Characterization of the differentiation potentials of thymic LinCD25CD117hi EGFPCCR9hi and EGFPCCR9low cells. (A) 500 cells of the indicated phenotypes were cultured under serum-free conditions on methylcellulose containing IL-7, SCF, and Flt3L for 5 d, after which the number of living cells per cell plated was determined. Mean and standard deviation of three independent experiments are shown for each cell type. (B) Pools of 2,000 cells of the indicated phenotype were cultured on a layer of OP9 or ST2 stromal cells in the presence of IL-7, SCF, Flt3L, and IL-2 and analyzed at the indicated time points. Empty plots indicate absence of living cells. The percentages for the respective quadrants are shown. (C) The frequency of B cell precursors among thymic LinCD25CD117hiEGFPCCR9hi and EGFPCCR9low cells was determined by limiting dilution assays. Both cell types were sorted in pools of 20, 40, and 80 cells (n = 30) onto OP9 stromal layers and cultured for 9 and 12 d, respectively. The failure to detect B lymphopoiesis is plotted. (D) RT-PCR analyses on RNA isolated from thymic LinCD25CD117hiEGFPCCR9hi (EGFPhi) cells and total bone marrow cells (control) with primers specific for the indicated transcripts. Mock RT-PCR samples remained negative. (E) Phenotypic analysis of cells derived from a representative culture of LinCD25CD117hiEGFPCCR9hi cells on an ST2 stromal cell layer. No difference was found between cultures of thymic LinCD25CD117hiEGFPCCR9hi and EGFPCCR9low cells. Contour plots on the left are gated on lymphoid cells and show the results of one multiparameter FACS analysis demonstrating the presence of dendritic cells. Contour plots on the right are gated on large, complex, immature myeloid cells and also show the results derived from one multiparameter staining. (F) The morphology of cells in cultures of thymic precursors on ST2 stromal cell layers was determined for a culture that contained predominantly immature myeloid cells as shown in (E, right panels) by staining of cells spun onto a glass slide according to Pappenheim. The majority of cells showed a blast-like morphology (top left) and some resembled bone marrow myeloblasts (bottom left). Few mature granulocytes also were observed (e.g., a neutrophilic granulocyte [top right] and a basophilic granulocyte [bottom right]). Bar, 10 μm.
Figure 5.
Figure 5.
Analysis of the differentiation potential of TMPs on the single cell level. (A) 100 TMPs were cultured on stromal layers of OP9, OP9-DL1, or a mixture of OP9/OP9-DL1 (20:1) in the presence of IL-7, SCF, Flt3L, and IL-2 for 12 d. At that time, cultures were analyzed by FACS. Contour plots in the middle are gated on NK1.1CD19 cells found in the bottom left quadrants of contour plots on the left. Contour plots on the right are gated on cells lacking the markers CD4, CD8, and CD3ɛ (triple-negative cells). The percentages for the respective quadrants are shown. Coreceptor double-positive cells were found in cultures on OP9-DL1 stromal cell layers after 16–19 d. (B) Double-sorted, single TMPs were placed into the wells of a 96-well plate onto OP9/OP9-DL1 (20:1) stromal cell layers and cultured as in (A). The reanalysis of TMPs double-sorted to a purity of >99.9% is shown (top left contour plot). Single TMPs that were transferred after 12 d from the OP9:OP9-DL1 mixture onto a fresh layer of OP9-DL1 cells generated double-positive cells after 16–19 d of culture (top right contour plot). To demonstrate that T, B, and dendritic cells could be derived from a single cell, productive cultures were split after 10 d onto methylcellulose containing IL-1β, IL-3, IL-6, SCF, and Flt3L. OP9/OP9-DL1 cultures were analyzed after 12 d (bottom left and middle panel) and methylcellulose cultures were analyzed 4 d after the split (bottom right panel). The bottom panels show the results of one representative singly-sorted TMP. The bottom middle contour plot is gated on NK1.1CD19 cells found in the bottom left quadrant of the bottom left contour plot.

References

    1. Kondo, M., A.J. Wagers, M.G. Manz, S.S. Prohaska, D.C. Scherer, G.F. Beilhack, J.A. Shizuru, and I.L. Weissman. 2003. Biology of hematopoietic stem cells and progenitors: implications for clinical application. Annu. Rev. Immunol. 21:759–806. - PubMed
    1. Frey, J.R., B. Ernst, C.D. Surh, and J. Sprent. 1992. Thymus-grafted SCID mice show transient thymopoiesis and limited depletion of V beta 11+ T cells. J. Exp. Med. 175:1067–1071. - PMC - PubMed
    1. Kondo, M., D.C. Scherer, A.G. King, M.G. Manz, and I.L. Weissman. 2001. Lymphocyte development from hematopoietic stem cells. Curr. Opin. Genet. Dev. 11:520–526. - PubMed
    1. Igarashi, H., S. Gregory, T. Yokota, N. Sakaguchi, and P. Kincade. 2002. Transcription from the RAG1 locus marks the earliest lymphocyte progenitors in bone marrow. Immunity. 17:117–130. - PubMed
    1. Adolfsson, J., O.J. Borge, D. Bryder, K. Theilgaard-Monch, I. Astrand-Grundstrom, E. Sitnicka, Y. Sasaki, and S.E. Jacobsen. 2001. Upregulation of Flt3 expression within the bone marrow Lin(-) Sca1(+)c-kit(+) stem cell compartment is accompanied by loss of self-renewal capacity. Immunity. 15:659–669. - PubMed

Publication types

MeSH terms