. 2005 Jul 5;102(27):9625-30.
doi: 10.1073/pnas.0504126102. Epub 2005 Jun 27.

High-resolution genomic profiles of human lung cancer

Affiliations

High-resolution genomic profiles of human lung cancer

Giovanni Tonon et al. Proc Natl Acad Sci U S A. .

Abstract

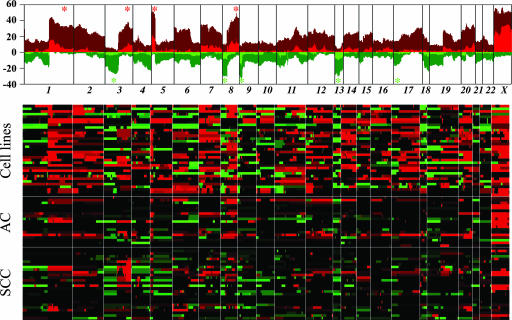
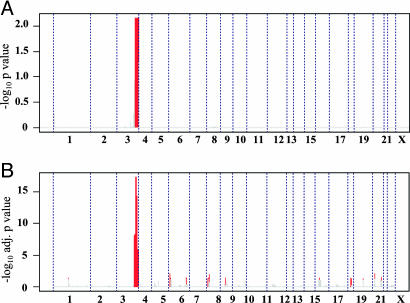
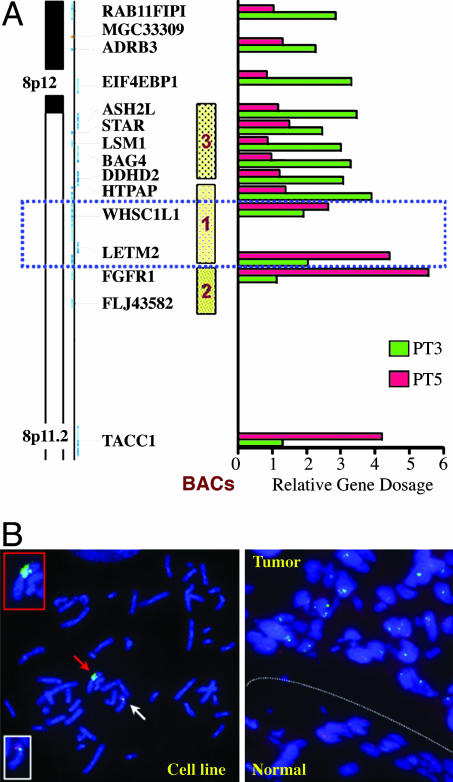
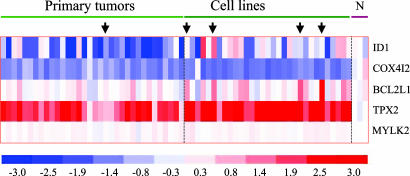
Lung cancer is the leading cause of cancer mortality worldwide, yet there exists a limited view of the genetic lesions driving this disease. In this study, an integrated high-resolution survey of regional amplifications and deletions, coupled with gene-expression profiling of non-small-cell lung cancer subtypes, adenocarcinoma and squamous-cell carcinoma (SCC), identified 93 focal copy-number alterations, of which 21 span <0.5 megabases and contain a median of five genes. Whereas all known lung cancer genes/loci are contained in the dataset, most of these recurrent copy-number alterations are previously uncharacterized and include high-amplitude amplifications and homozygous deletions. Notably, despite their distinct histopathological phenotypes, adenocarcinoma and SCC genomic profiles showed a nearly complete overlap, with only one clear SCC-specific amplicon. Among the few genes residing within this amplicon and showing consistent overexpression in SCC is p63, a known regulator of squamous-cell differentiation. Furthermore, intersection with the published pancreatic cancer comparative genomic hybridization dataset yielded, among others, two focal amplicons on 8p12 and 20q11 common to both cancer types. Integrated DNA-RNA analyses identified WHSC1L1 and TPX2 as two candidates likely targeted for amplification in both pancreatic ductal adenocarcinoma and non-small-cell lung cancer.


Figures

Fig. 1.
Fig. 1.
Genomic profiles of primary lung AC and squamous carcinomas and lung cancer cell lines. (Upper) Recurrence of chromosomal alterations. Integer-value recurrence of CNAs in segmented data (y axis) is plotted for each probe evenly aligned along the x axis in chromosome order. Dark red or green bars denote gain or loss of chromosome material, and bright red or green bars represent probes within regions of amplification or deletion (see Materials and Methods). Asterisks identify the most frequent region of gains (red) and losses (green), as reported in ref. . (Lower) Heat-map plot showing discrete CNAs within all samples, with the x axis representing probes ordered by genomic map positions and the y axis representing individual samples. Red represents chromosomal gain/amplification, and green denotes chromosomal loss/deletion.
Fig. 2.
Fig. 2.
Chromosome 3q, from 180 to 199 Mb, is the only genomic region that shows a significant difference between AC and SCC by both aCGH (A) and expression (B) profiling. On both plots, x-axis coordinates represent probes ordered by genomic map positions, from chromosome 1 to chromosome X. (A) Probes significantly gained/amplified, comparing SCC and AC primary tumors, on aCGH. The y axis represents the -log10 P value of the permutation test. Probes presenting a P < 0.05 are plotted in red, and probes with a P > 0.05 are plotted in gray. No probes were significantly lost/deleted after comparison between SCC and AC primary tumors. (B) Genomic regions significantly enriched for differentially expressed probes comparing SCC and AC primary tumors. The y axis represents the -log10 adjusted P values of Fisher's exact test for enrichment. Red lines highlight regions with a P < 0.05, adjusted for multiple testing, and probes with an adjusted P > 0.05 are in gray.
Fig. 3.
Fig. 3.
Verification and boundary delimitation of the 8p12–p11.2 amplicon. (A) Real-time PCR verification of the 8p amplicon and its boundaries. Two primary tumors were used to delimit the boundaries, PT3 and PT5. The dotted blue rectangle includes the genes involved in the amplicon. (B Left) Metaphase FISH analysis of the cell line NCI-H1703, showing multiple green signals on one derivative chromosome (red arrow and Upper Inset). Green signal, BAC 2. A normal copy of chromosome 8 is also evident (white arrow and Lower Inset), showing two signals for BAC 2 (green) and two signals for the control BAC (RP11–138J2), red signal. (Right) Interphase FISH analysis on a section from the primary tumor PT3, comparing adjacent normal and tumor tissues. Note multiple, high-intensity signals with BAC 1 (green) in the tumor part and single or double signals with BAC 1 in the normal part of the section. Control, BAC (RP11–138J2), red signal.
Fig. 4.
Fig. 4.
Expression analyses of genes residing in the chromosome-20q11 amplicon. Heat-map representation of the expression level of each of the five genes, ID1, COX4I2, BCL2L1, TPX2, and MYLK2, in the amplicon from Affymetrix analysis. When multiple Affymetrix probes for a gene were present, the median value among the probes was used. Each column represents an individual sample, and each row represents a gene. N, normal lung tissue. The color intensity on the heat map correlates with the intensity of the expression, with red representing overexpression and blue indicating reduced expression. The arrows indicate the samples that present amplification.

References

    1. Pao, W. & Miller, V. A. (2005) J. Clin. Oncol. 23, 2556-2568. - PubMed
    1. Minna, J. D., Roth, J. A. & Gazdar, A. F. (2002) Cancer Cell 1, 49-52. - PubMed
    1. Bjorkqvist, A. M., Husgafvel-Pursiainen, K., Anttila, S., Karjalainen, A., Tammilehto, L., Mattson, K., Vainio, H. & Knuutila, S. (1998) Genes Chromosomes Cancer 22, 79-82. - PubMed
    1. Luk, C., Tsao, M. S., Bayani, J., Shepherd, F. & Squire, J. A. (2001) Cancer Genet. Cytogenet. 125, 87-99. - PubMed
    1. Pei, J., Balsara, B. R., Li, W., Litwin, S., Gabrielson, E., Feder, M., Jen, J. & Testa, J. R. (2001) Genes Chromosomes Cancer 31, 282-287. - PubMed

Publication types

MeSH terms