. 2005 Jul;3(7):e229.
doi: 10.1371/journal.pbio.0030229. Epub 2005 Jun 21.

Population fitness and the regulation of Escherichia coli genes by bacterial viruses

Affiliations

Population fitness and the regulation of Escherichia coli genes by bacterial viruses

Ying Chen et al. PLoS Biol. 2005 Jul.

Abstract

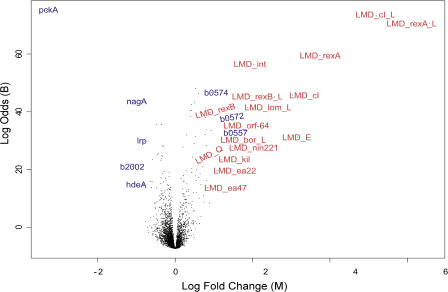
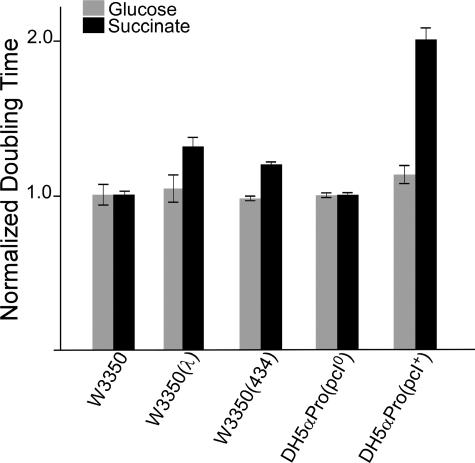
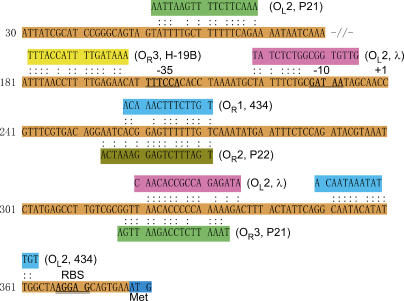
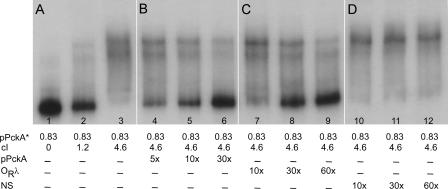
Temperate bacteriophage parasitize their host by integrating into the host genome where they provide additional genetic information that confers higher fitness on the host bacterium by protecting it against invasion by other bacteriophage, by increasing serum resistance, and by coding for toxins and adhesion factors that help the parasitized bacterium invade or evade its host. Here we ask if a temperate phage can also regulate host genes. We find several different host functions that are down-regulated in lysogens. The pckA gene, required for gluconeogenesis in all living systems, is regulated directly by the principal repressor of many different temperate prophage, the cI protein. cI binds to the regulatory region of pckA, thereby shutting down pckA transcription. The pckA regulatory region has target sequences for many other temperate phage repressors, and thus we suggest that down-regulation of the host pckA pathway increases lysogen fitness by lowering the growth rate of lysogens in energy-poor environments, perhaps as an adaptive response to the host predation system or as an aspect of lysogeny that must be offset by down-regulating pckA.


Figures

Figure 1
Figure 1. The λ Life Cycle and Gene Organization
(A) The lytic compared to the lysogenic life cycle. Invading phage can either replicate and lyse the host cell (1), or they can integrate into the host genome (2) where they replicate as part of the host genome. At a frequency of approximately 10−6 to 10−5 per cell division, the prophage escapes cI repression, replicates, and lyses the host (3) (B) The genetic map showing the approximate organization of functional blocks and, below the map, the location of the genes up and down regulated as revealed in this study. The lom gene is embedded between two different tail-fiber genes. The genome length is 48.5 kb, approximately 75 genes. See [2,29].
Figure 2
Figure 2. Gene Expression Pattern in Lysogen versus Nonlysogen
In this representation, the log of the odds (B) [30] is plotted against the log of the ratio of the change (M) for each gene. The larger the odds, the higher the confidence in the fold change. M is log2(Rlysogen/Gnonlysogen), where R is the signal in the red channel and G the signal in the green. Twelve samples from each of two exponentially growing lysogen and nonlysogen cultures were harvested at 6-min intervals and used to prepare cDNA probes as described in Materials and Methods. cDNA samples from each time point were labeled separately with Cy3 and Cy5, mixed, and then used to probe the microarrays in duplicate. For each time point, Cy3 and Cy5 labels were reversed, and reversed labels were also used to probe the microarrays in duplicate. Thus each time point is the average of four datasets, and the data in Table 1 and Figure 2 represent 48 arrays probed with cDNA from exponentially growing cells. The dataset on which Table 1 is based may be found in supplemental Table S1.
Figure 3
Figure 3. The Growth of Lysogens and Nonlysogens in Glucose and Succinate Media
In this figure, pcI codes for cI, and pcI0 is the empty vector. See Materials and Methods for the genotypes of these strains. Growth rates were obtained by least-square fit of the optical density versus time curves. Error bars for the growth rates were obtained by fitting two subsets of the data and using the standard deviation of the two estimates.
Figure 4
Figure 4. The Upstream pckA Region Homologous to Known Temperate Bacteriophage Operator Sites
OR3, OL2, OR1, and OR2 are sequences known to bind either cI or the cI homologs of the lysogenic bacteriophage H-19B, λ, 434, P22, P21, and 434 shown in brackets next to each operator sequence [6,31,32]. A second P21 OL2 site lies further upstream from the −35 region.
Figure 5
Figure 5. cI Binds to the pckA Promoter Region
In these experiments, affinity-purified cI was added in variable (0 μM, 1.15 μM, and 4.6 μM, lanes 1, 2, and 3, respectively) or constant (4.6 μM, lanes 4–12) amounts to 32P-labeled upstream pckA DNA (pPckA*, 0.83 nM each lane). In lanes 4–5, a 5-, 10-, and 30-fold excess of unlabeled pckA DNA was added as competitor. In lanes 7–9, a 10-, 30-, and 60-fold excess of unlabeled λ OR DNA was the competitor. In lanes 10–12, a 10-, 30-, and 60-fold excess of unlabeled random λ OR1 sequence (nonspecific) was added (see Materials and Methods).

Similar articles

Cited by

References

    1. Ackermann H-W, DuBow MS. Viruses of prokaryotes. Boca Raton (Florida): CRC Press; 1987. 480 pp.
    1. Hendrix RW. Lambda II. Cold Spring Harbor (New York): Cold Spring Harbor Laboratory Press; 1983. 694 pp.
    1. Adams MH. Bacteriophages. New York: Interscience Publishers; 1959. 592 pp.
    1. Wagner PL, Waldor MK. Bacteriophage control of bacterial virulence. Infect Immun. 2002;70:3985–3993. - PMC - PubMed
    1. Hendrix RW, Smith MC, Burns RN, Ford ME, Hatfull GF. Evolutionary relationships among diverse bacteriophages and prophages: All the world's a phage. Proc Natl Acad Sci U S A. 1999;96:2192–2197. - PMC - PubMed

Publication types

MeSH terms

Substances