

Estimation of airway obstruction using oximeter plethysmograph waveform data
- PMID: 15985171
- PMCID: PMC1168908
- DOI: 10.1186/1465-9921-6-65
Estimation of airway obstruction using oximeter plethysmograph waveform data
Abstract
Background: Validated measures to assess the severity of airway obstruction in patients with obstructive airway disease are limited. Changes in the pulse oximeter plethysmograph waveform represent fluctuations in arterial flow. Analysis of these fluctuations might be useful clinically if they represent physiologic perturbations resulting from airway obstruction. We tested the hypothesis that the severity of airway obstruction could be estimated using plethysmograph waveform data.
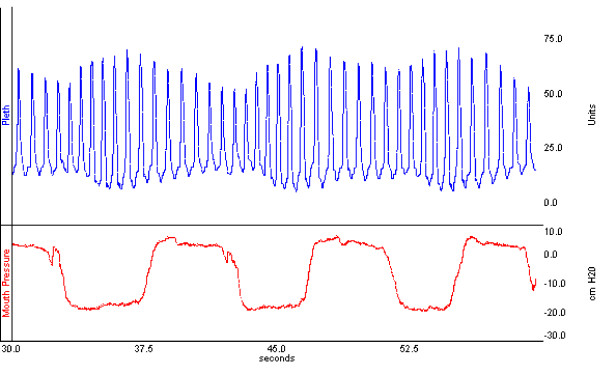
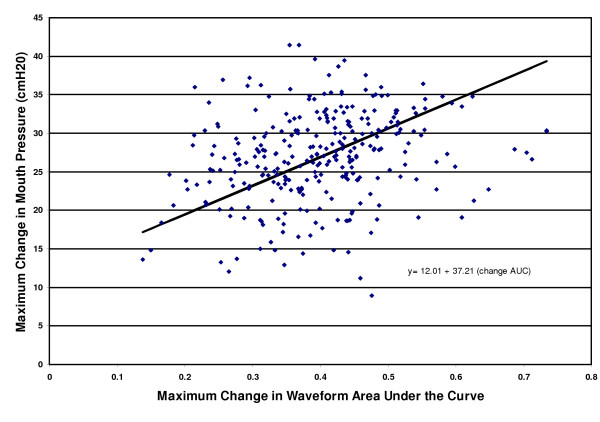
Methods: Using a closed airway circuit with adjustable inspiratory and expiratory pressure relief valves, airway obstruction was induced in a prospective convenience sample of 31 healthy adult subjects. Maximal change in airway pressure at the mouthpiece was used as a surrogate measure of the degree of obstruction applied. Plethysmograph waveform data and mouthpiece airway pressure were acquired for 60 seconds at increasing levels of inspiratory and expiratory obstruction. At each level of applied obstruction, mean values for maximal change in waveform area under the curve and height as well as maximal change in mouth pressure were calculated for sequential 7.5 second intervals. Correlations of these waveform variables with mouth pressure values were then performed to determine if the magnitude of changes in these variables indicates the severity of airway obstruction.
Results: There were significant relationships between maximal change in area under the curve (P < .0001) or height (P < 0.0001) and mouth pressure.
Conclusion: The findings suggest that mathematic interpretation of plethysmograph waveform data may estimate the severity of airway obstruction and be of clinical utility in objective assessment of patients with obstructive airway diseases.
Figures
Similar articles
-
Noninvasive assessment of asthma severity using pulse oximeter plethysmograph estimate of pulsus paradoxus physiology.BMC Pulm Med. 2010 Mar 29;10:17. doi: 10.1186/1471-2466-10-17. BMC Pulm Med. 2010. PMID: 20350320 Free PMC article.
-
Comparison of traditional and plethysmographic methods for measuring pulsus paradoxus.Arch Pediatr Adolesc Med. 2004 Jan;158(1):48-51. doi: 10.1001/archpedi.158.1.48. Arch Pediatr Adolesc Med. 2004. PMID: 14706958
-
Arterial and plethysmographic waveform analysis in anesthetized patients with hypovolemia.Anesthesiology. 2010 Jul;113(1):83-91. doi: 10.1097/ALN.0b013e3181da839f. Anesthesiology. 2010. PMID: 20526193
-
Excessive variations in the plethysmographic waveform during spontaneous ventilation: an important sign of upper airway obstruction.Anesth Analg. 2014 Dec;119(6):1288-92. doi: 10.1213/ANE.0000000000000378. Anesth Analg. 2014. PMID: 25405690
-
The use of joint time frequency analysis to quantify the effect of ventilation on the pulse oximeter waveform.J Clin Monit Comput. 2006 Apr;20(2):81-7. doi: 10.1007/s10877-006-9010-7. Epub 2006 Jun 1. J Clin Monit Comput. 2006. PMID: 16779621
Cited by
-
Clinical applications of photoplethysmography in paediatric intensive care.Intensive Care Med. 2008 Mar;34(3):578-82. doi: 10.1007/s00134-007-0951-1. Epub 2007 Dec 11. Intensive Care Med. 2008. PMID: 18071671
-
Respiratory waveform variation can prevent pulsus paradoxus measurement by sphygmomanometry.J Asthma. 2019 Jul;56(7):687-692. doi: 10.1080/02770903.2018.1490959. Epub 2018 Aug 29. J Asthma. 2019. PMID: 29972658 Free PMC article.
-
Identifying airway obstructions using photoplethysmography (PPG).J Clin Monit Comput. 2008 Apr;22(2):95-101. doi: 10.1007/s10877-008-9110-7. Epub 2008 Jan 25. J Clin Monit Comput. 2008. PMID: 18219579 Clinical Trial.
-
Development and internal validation of a pediatric acute asthma prediction rule for hospitalization.J Allergy Clin Immunol Pract. 2015 Mar-Apr;3(2):228-35. doi: 10.1016/j.jaip.2014.09.017. Epub 2014 Nov 25. J Allergy Clin Immunol Pract. 2015. PMID: 25609324 Free PMC article.
-
Noninvasive assessment of asthma severity using pulse oximeter plethysmograph estimate of pulsus paradoxus physiology.BMC Pulm Med. 2010 Mar 29;10:17. doi: 10.1186/1471-2466-10-17. BMC Pulm Med. 2010. PMID: 20350320 Free PMC article.
References
-
- Mannino DM, Homa DM, Akinbami LJ, Moorman JE, Gwynn C, Redd SC. Surveillance for asthma--United States, 1980-1999. MMWR Surveill Summ. 2002;51:1–13. - PubMed
-
- Asthma prevalence and control characteristics by race/ethnicity---United States, 2002. MMWR Morb Mortal Wkly Rep. 2004;53:145–148. - PubMed
-
- Asthma mortality and hospitalization among children and young adults--United States, 1980-1993. MMWR Morb Mortal Wkly Rep. 1996;45:350–353. - PubMed
-
- Denny FW, Clyde WAJ. Acute lower respiratory tract infections in nonhospitalized children. J Pediatr. 1986;108:635–646. - PubMed
Publication types
MeSH terms
LinkOut - more resources
Full Text Sources
Other Literature Sources
Medical
