. 2005 Jun 28:2:15.
doi: 10.1186/1743-0003-2-15.

A dynamic neuro-fuzzy model providing bio-state estimation and prognosis prediction for wearable intelligent assistants

Affiliations

A dynamic neuro-fuzzy model providing bio-state estimation and prognosis prediction for wearable intelligent assistants

Yu Wang et al. J Neuroeng Rehabil. .

Abstract

Background: Intelligent management of wearable applications in rehabilitation requires an understanding of the current context, which is constantly changing over the rehabilitation process because of changes in the person's status and environment. This paper presents a dynamic recurrent neuro-fuzzy system that implements expert-and evidence-based reasoning. It is intended to provide context-awareness for wearable intelligent agents/assistants (WIAs).

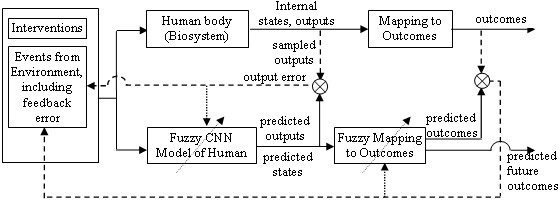
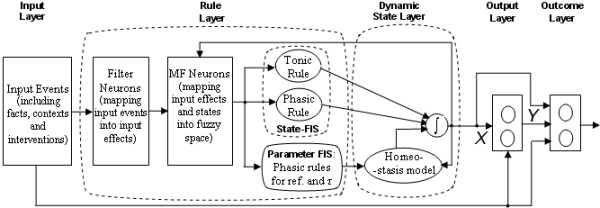
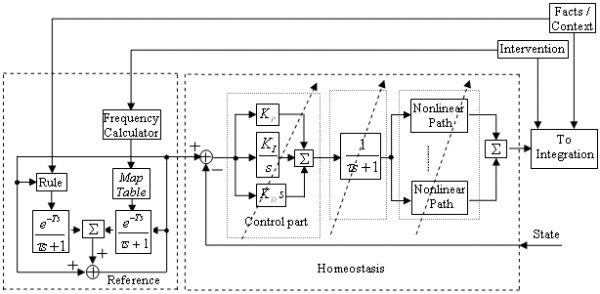
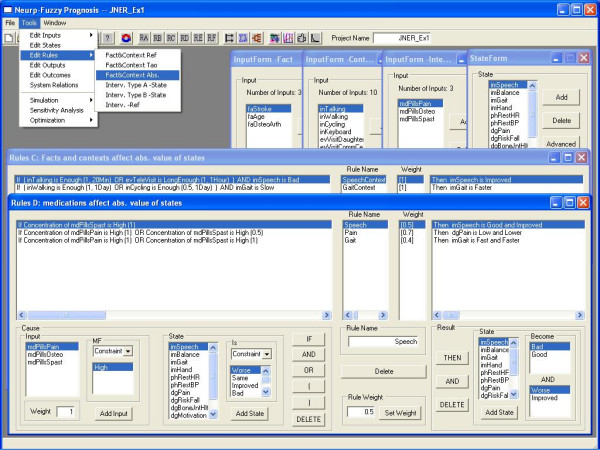
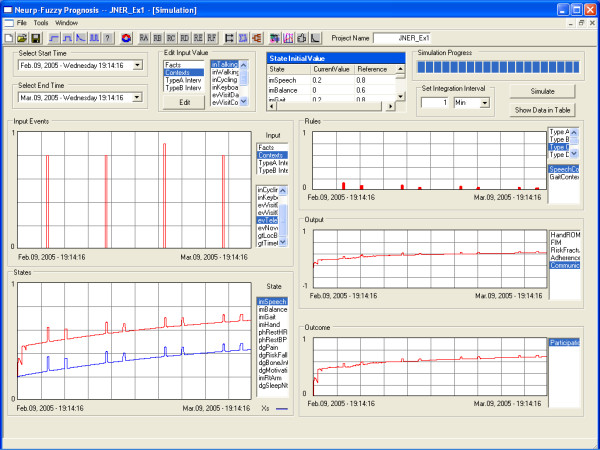
Methods: The model structure includes the following types of signals: inputs, states, outputs and outcomes. Inputs are facts or events which have effects on patients' physiological and rehabilitative states; different classes of inputs (e.g., facts, context, medication, therapy) have different nonlinear mappings to a fuzzy "effect." States are dimensionless linguistic fuzzy variables that change based on causal rules, as implemented by a fuzzy inference system (FIS). The FIS, with rules based on expertise and evidence, essentially defines the nonlinear state equations that are implemented by nuclei of dynamic neurons. Outputs, a function of weighing of states and effective inputs using conventional or fuzzy mapping, can perform actions, predict performance, or assist with decision-making. Outcomes are scalars to be extremized that are a function of outputs and states.

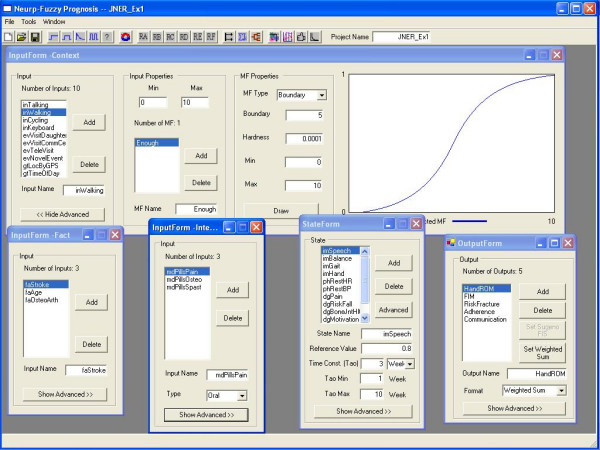
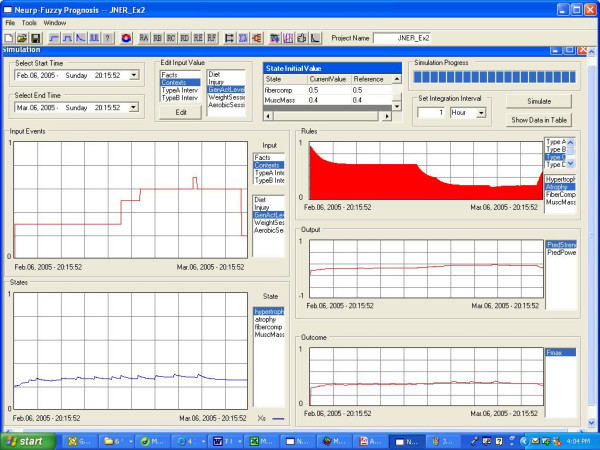
Results: The first example demonstrates setup and use for a large-scale stroke neurorehabilitation application (with 16 inputs, 12 states, 5 outputs and 3 outcomes), showing how this modelling tool can successfully capture causal dynamic change in context-relevant states (e.g., impairments, pain) as a function of input event patterns (e.g., medications). The second example demonstrates use of scientific evidence to develop rule-based dynamic models, here for predicting changes in muscle strength with short-term fatigue and long-term strength-training.

Conclusion: A neuro-fuzzy modelling framework is developed for estimating rehabilitative change that can be applied in any field of rehabilitation if sufficient evidence and/or expert knowledge are available. It is intended to provide context-awareness of changing status through state estimation, which is critical information for WIA's to be effective.


Figures

Figure 1
Figure 1
Structural relation between the model and the real human system. The intervention plan drives both the real system and fuzzy model, with the sampled (measured) output signals feedback back as an error event signal, and outcome error signals available to mildly tune the adaptive state estimators and output and outcome predictors. Targeted parameters can include input or output mappings or rule weights. When used in a simulation mode, the model can be used to predict the consequences of alternative treatment/intervention plans, and thus help the user optimize the intervention strategy. CNN: connectionist neural network. Dashed line: Sampling. Dotted line: future adaptive CNN work.
Figure 2
Figure 2
Layer structure of the model. Most of the neurons in the input layer detect the occurrence of events and mapping the events into fuzzy variables. Others are pre-processing neurons for certain types of inputs, such as performing as pharmacokinetic models to map the dose and/or regimen of one kind of medication into the effective concentration, or integration neurons to calculate the accumulative effect of interventions. For each state, there are generally five nuclei in the rule-state layer. The outputs of tonic rules nuclei determine the absolute value of the state, and the phasic rules nuclei brings the instant change to the state. (Specially, the nuclei connect the fact/context and the states as tonic rules and phasic rules, with neuronal leaky integrators defined by a time constant to describe how fast the caused change in states reaches its result value.) One nuclei functions as homeostasis mechanism, whose reference is given by the output of phasic rule for reference nuclei (see also Figure 3). The last nuclei works as a math model to relate the Type B interventions and the change of the state. The output of the integration neuron in the rule-state layer is the state X, which then along with inputs are mapped into output Y. The outcome J is a function of all inputs, states, and outputs.
Figure 3
Figure 3
The structure of nuclei for reference and homeostasis. A fact event can changes the reference via its own FIS (Rule Type A), and the change will be added to the reference through a first order system with a certain time of delay. When a context event happens, it will affect the reference in the same way as fact events. When there is an intervention, its frequency at the point will be calculated based on the history by a frequency calculator. A user-defined mapping function will then be applied to calculate the change. The mapping function maps the frequency and intensity of the intervention and the initial reference value into the result change. Then the change will be added to the reference through a first order system with a certain time of delay. The mapping function is defined by the user as two tables. If the frequency or the intensity is not in the table, the result change will be calculated by interpolation. All the result changes on the reference of one state caused by different inputs will be summed together by fuzzy OR operation, and then applied to the reference value. Users are encouraged to change references slowly and conservatively. The homeostasis nuclei sense the state value and compare it to the reference. Its output is sent to the integration neuron in the rule-state layer. In homeostasis nuclei, each path in control part and nonlinear paths and the feedback path can be turned on/off by the user. The fuzzy OR operation is used to assure the stability.
Figure 4
Figure 4
The interface the inputs, states and outputs in model #1. There are three facts (bottom left), ten contexts (up), three medications (bottom left two), twelve states (bottom right two) and five outputs (bottom right). User-designer can add or delete inputs, states, outputs or outcomes. For a selected variable, the user-designer is able to set the range (min and max), add/delete membership functions, define the membership functions, and see the graphics of the membership functions. If the variable is a state, the user-designer also has access to the reference, time constant, the negative feedback (on/off), and all of the control parameters.
Figure 5
Figure 5
Type C rules and type D rules in model #1. There are six types of rules (RA to RF) based on what kind of relation they represent between inputs and states. For example, RC (back window) describes how the facts/contexts change the states' values directly, and RD (front window) defines the relation between medication and affected states. The user-designer can add, delete and change rules, and also change the properties of rules such as rule name and rule weight. When working on "If" side or "Then" side, user-designer can add an element, or delete the right-most element, which is demonstrated helpful for designing rules. In the "If" part, several options are available to help define precise and flexible rules. These operations include: "AND" and "OR" operations, constraints (such as "NOT", "VERY", and "NOT VERY"). There is also a weight for each input element.
Figure 6
Figure 6
Example simulation result of model #1. The simulation period is from Feb. 09 2005 to Mar. 09 2005 (see top left). This figure shows the event train of TeleVisit in the input frame (up left), the status of Speech (bottom left), the rule firing rate of SpeechContext (up right), the output Communication (middle right) and the outcome Participation (bottom right). In the state frame, the blue line is the curve without medication and the red line the curve with medication. Comparing the event train of TeleVisit and the curve of the Speech, we can see clearly the effect of every TeleVisit on the Speech. The other protuberance on the Speech curve is caused by the visit to the local community center on every Tuesday.
Figure 7
Figure 7
Example simulation of the "adaptive model" of Table 2. For this simulation, the following four simple rules were used, one for each state: IF WeightSession is intense & (Diet is good & Hypertrophy is Low) THEN Hypertrophy is high & higher IF (GenActLevel is low & AerobicSess is not intense) or Injury is bad THEN Atrophy is high & higher IF WeightSession is intense & AerobicSess is not intense & FiberComp is low THEN Fibercomp is high & higher IF Hypertrophy is high & (WeightSession is not intense & Diet is not good & AerobicSess not intense THEN MuscMass is high & higher Since only one input, state, rule, etc can be shown in an image (user can easily toggle between them), others are described here. At the start the client has states that reflect a sedentary lifestyle. Inputs reflect that he gradually increases his general activity level (this is the input that happens to be shown), improves his diet, and starts a weight-training program. This continues for three weeks through the end of February, at which time he stops the weight training and starts an aerobic training program. However, on his fourth aerobic event, he gets injured and his activity decreases. The hypertrophy and atrophy states are viewed as bioprocesses that are always somewhat present, and compete with each other. Of the four states, the hypertrophy state is shown (lower left), and we see an initial rise and a subsequent mild effect of each weight training session. After these inputs stop the state falls a bit. The atrophy state follows the shape of the atrophy rule, which is shown (upper right). Notice that with increases in various activities, atrophy rule firing decreases until the injury occurs. The output (predicted strength) is assumed a weighted function of all states, and the "outcome" Fmax (which could have also been viewed as an output) is a weighted function of the predicted strength and some of the states. Both show increases with these lifestyle changes, then the start of a decrease after the injury.

Similar articles

References

    1. Winters JM. Emerging rehabilitative telehealthcare anywhere. Was the Homecare Technologies Workshop visionary? In: Winters JM, Robinson C, Simpson R, Vanderheiden G, editor. Emerging and Accessible Telecommunications, Information and Healthcare Technologies. Arlington: RESNA Press; 2002. pp. 95–111.
    1. Winters JM, Herman W. Report of the Workshop on Home Care Technologies for the 21st Century. Catholic University of America, Washington DC Tech Rep HCTR-10-v10. 2000. p. 96.http://www.eng.mu.edu/wintersj/HCTWorkshop
    1. Winters JM. Telerehabilitation research: Emerging possibilities. Annu Rev Biomed Eng. 2002;4:287–320. doi: 10.1146/annurev.bioeng.4.112801.121923. - DOI - PubMed
    1. Winters JM. Mobile telerehabilitative healthcare technologies. In: Rosen MJ, Lauderdale D, editor. Proceedings of the state of the science conference on telerehabiliation and application of virtual reality. Washington DC: NRH Press; 2001. pp. 102–108.
    1. American Physical Therapy Association Guide to Physical Therapist Practice. 1997. ch1.