

Quantitative evaluation of automated skull-stripping methods applied to contemporary and legacy images: effects of diagnosis, bias correction, and slice location
- PMID: 15986433
- PMCID: PMC2408865
- DOI: 10.1002/hbm.20161
Quantitative evaluation of automated skull-stripping methods applied to contemporary and legacy images: effects of diagnosis, bias correction, and slice location
Abstract
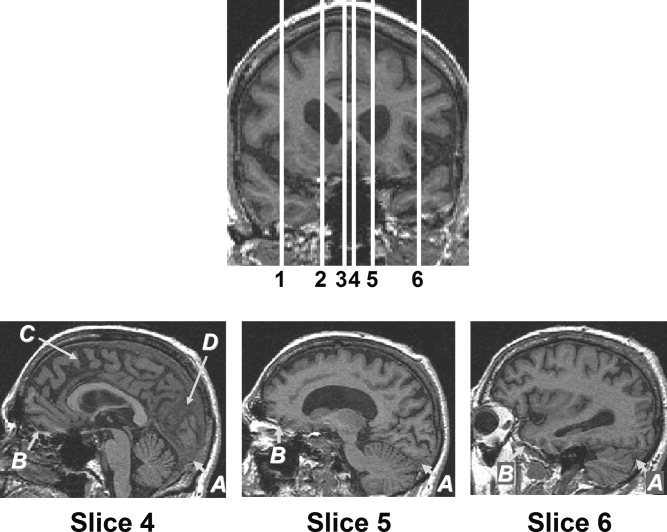
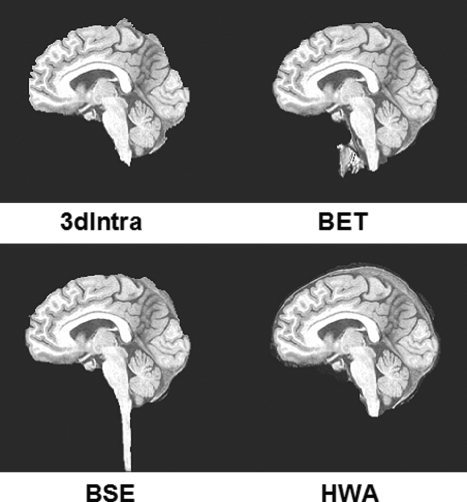
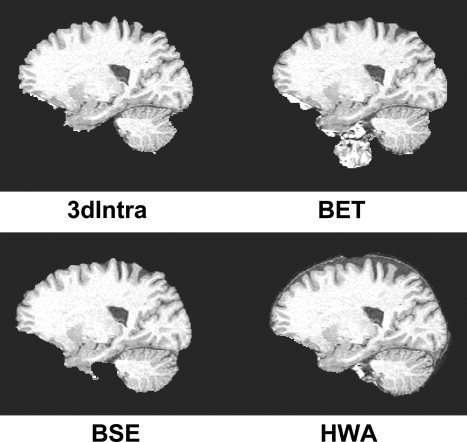
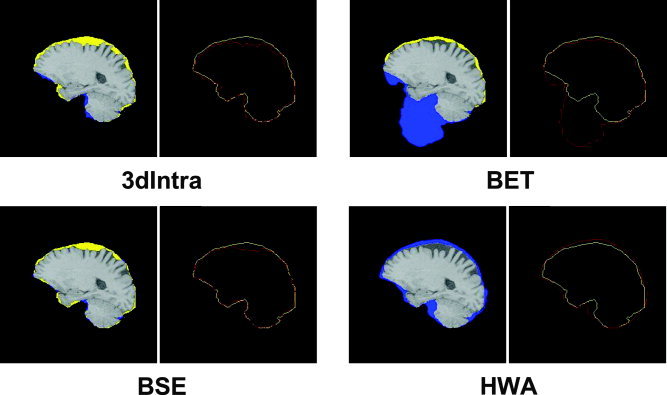
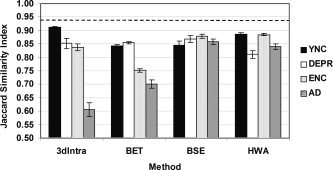
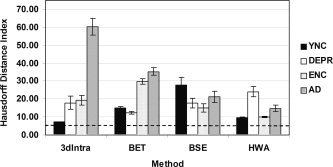
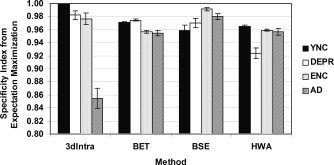
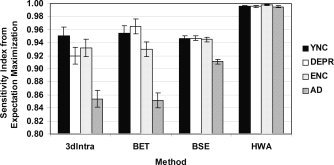
Performance of automated methods to isolate brain from nonbrain tissues in magnetic resonance (MR) structural images may be influenced by MR signal inhomogeneities, type of MR image set, regional anatomy, and age and diagnosis of subjects studied. The present study compared the performance of four methods: Brain Extraction Tool (BET; Smith [2002]: Hum Brain Mapp 17:143-155); 3dIntracranial (Ward [1999] Milwaukee: Biophysics Research Institute, Medical College of Wisconsin; in AFNI); a Hybrid Watershed algorithm (HWA, Segonne et al. [2004] Neuroimage 22:1060-1075; in FreeSurfer); and Brain Surface Extractor (BSE, Sandor and Leahy [1997] IEEE Trans Med Imag 16:41-54; Shattuck et al. [2001] Neuroimage 13:856-876) to manually stripped images. The methods were applied to uncorrected and bias-corrected datasets; Legacy and Contemporary T1-weighted image sets; and four diagnostic groups (depressed, Alzheimer's, young and elderly control). To provide a criterion for outcome assessment, two experts manually stripped six sagittal sections for each dataset in locations where brain and nonbrain tissue are difficult to distinguish. Methods were compared on Jaccard similarity coefficients, Hausdorff distances, and an Expectation-Maximization algorithm. Methods tended to perform better on contemporary datasets; bias correction did not significantly improve method performance. Mesial sections were most difficult for all methods. Although AD image sets were most difficult to strip, HWA and BSE were more robust across diagnostic groups compared with 3dIntracranial and BET. With respect to specificity, BSE tended to perform best across all groups, whereas HWA was more sensitive than other methods. The results of this study may direct users towards a method appropriate to their T1-weighted datasets and improve the efficiency of processing for large, multisite neuroimaging studies.
Performance of automated methods to isolate brain from nonbrain tissues in magnetic resonance (MR) structural images may be influenced by MR signal inhomogeneities, type of MR image set, regional anatomy, and age and diagnosis of subjects studied. The present study compared the performance of four methods: Brain Extraction Tool (BET; Smith [2002]: Hum Brain Mapp 17:143–155); 3dIntracranial (Ward [1999] Milwaukee: Biophysics Research Institute, Medical College of Wisconsin; in AFNI); a Hybrid Watershed algorithm (HWA, Segonne et al. [2004] Neuroimage 22:1060–1075; in FreeSurfer); and Brain Surface Extractor (BSE, Sandor and Leahy [1997] IEEE Trans Med Imag 16:41–54; Shattuck et al. [2001] Neuroimage 13:856–876) to manually stripped images. The methods were applied to uncorrected and bias‐corrected datasets; Legacy and Contemporary T1‐weighted image sets; and four diagnostic groups (depressed, Alzheimer's, young and elderly control). To provide a criterion for outcome assessment, two experts manually stripped six sagittal sections for each dataset in locations where brain and nonbrain tissue are difficult to distinguish. Methods were compared on Jaccard similarity coefficients, Hausdorff distances, and an Expectation‐Maximization algorithm. Methods tended to perform better on contemporary datasets; bias correction did not significantly improve method performance. Mesial sections were most difficult for all methods. Although AD image sets were most difficult to strip, HWA and BSE were more robust across diagnostic groups compared with 3dIntracranial and BET. With respect to specificity, BSE tended to perform best across all groups, whereas HWA was more sensitive than other methods. The results of this study may direct users towards a method appropriate to their T1‐weighted datasets and improve the efficiency of processing for large, multisite neuroimaging studies. Hum. Brain Mapping, 2005. © 2005 Wiley‐Liss, Inc.
Copyright (c) 2005 Wiley-Liss, Inc.
Figures
References
-
- Arnold JB, Liow JS, Schaper KA, Stern JJ, Sled JG, Shattuck DW, Worth AJ, Cohen MS, Leahy RM, Mazziotta JC, et al. 2001. Qualitative and quantitative evaluation of six algorithms for correcting intensity nonuniformity effects. Neuroimage 13: 931–943. - PubMed
-
- Boesen K, Rehm K, Schaper K, Stoltzner S, Woods R, Luders E, Rottenberg D. 2004. Quantitative comparison of four brain extraction algorithms. Neuroimage 22: 1255–1261. - PubMed
-
- Cox RW. 1996. AFNI: software for analysis and visualization of functional magnetic resonance neuroimages. Comput Biomed Res 29: 162–173. - PubMed
-
- Dale AM, Fischl B, Sereno MI. 1999. Cortical surface‐based analysis. I. Segmentation and surface reconstruction. Neuroimage 9: 179–194. - PubMed
-
- DeCarli C, Maisog J, Murphy DG, Teichberg D, Rapoport SI, Horwitz B. 1992. Method for quantification of brain, ventricular, and subarachnoid CSF volumes from MR images. J Comput Assist Tomogr 16: 274–284. - PubMed
Publication types
MeSH terms
Grants and funding
- U24 RR021382/RR/NCRR NIH HHS/United States
- P41-RR14075/RR/NCRR NIH HHS/United States
- P50 AG005131/AG/NIA NIH HHS/United States
- P41-RR13642/RR/NCRR NIH HHS/United States
- R01 AG004085/AG/NIA NIH HHS/United States
- 5K08MH01642/MH/NIMH NIH HHS/United States
- M01RR00827/RR/NCRR NIH HHS/United States
- P41 RR013642/RR/NCRR NIH HHS/United States
- R01MH42575/MH/NIMH NIH HHS/United States
- R01 RR016594/RR/NCRR NIH HHS/United States
- K08 MH001642/MH/NIMH NIH HHS/United States
- R01 AG12674/AG/NIA NIH HHS/United States
- P50AGO5131/PHS HHS/United States
- P50 MH045294/MH/NIMH NIH HHS/United States
- AG04085/AG/NIA NIH HHS/United States
- R01 RR16594-01A1/RR/NCRR NIH HHS/United States
- M01 RR000827/RR/NCRR NIH HHS/United States
- R01 EB002010/EB/NIBIB NIH HHS/United States
LinkOut - more resources
Full Text Sources
Other Literature Sources
Medical
