. 2005 Jul;42(3):162-71.
doi: 10.1002/gene.20139.

Using a histone yellow fluorescent protein fusion for tagging and tracking endothelial cells in ES cells and mice

Affiliations

Using a histone yellow fluorescent protein fusion for tagging and tracking endothelial cells in ES cells and mice

Stuart T Fraser et al. Genesis. 2005 Jul.

Abstract

We report the first endothelial lineage-specific transgenic mouse allowing live imaging at subcellular resolution. We generated an H2B-EYFP fusion protein which can be used for fluorescent labeling of nucleosomes and used it to specifically label endothelial cells in mice and in differentiating embryonic stem (ES) cells. A fusion cDNA encoding a human histone H2B tagged at its C-terminus with enhanced yellow fluorescent protein (EYFP) was expressed under the control of an Flk1 promoter and intronic enhancer. The Flk1::H2B-EYFP transgenic mice are viable and high levels of chromatin-localized reporter expression are maintained in endothelial cells of developing embryos and in adult animals upon breeding. The onset of fluorescence in differentiating ES cells and in embryos corresponds with the beginning of endothelial cell specification. These transgenic lines permit real-time imaging in normal and pathological vasculogenesis and angiogenesis to track individual cells and mitotic events at a level of detail that is unprecedented in the mouse.


Figures

FIG. 1
FIG. 1
Construction of a Flk1::H2B-EYFP transgene. a: Structure of BAC clone containing Flk1 locus. Positions of 5′ upstream regulatory region (UPR) and intronic enhancer (enh) are shown. The Flk1 gene comprises 28 exons (Ex), of which the first two are indicated. Blue boxes represent the upstream regulatory region (UPR) and intronic enhancer (enh). b: Cartoon of Flk1::H2B-EYFP construct used for generation of transgenic ES cells and mice. The SV40 polyadenylation (pA) signal originated from pCX::H2B-EYFP (see Materials and Methods). The figure is drawn approximately to scale. In1; intron 1. B, BamHI; K, KpnI; N, NotI; P, PstI; R, EcoRI; S, SalI; X, XhoI; Xb, XbaI.
FIG. 2
FIG. 2
Expression of Flk1::H2B-EYFP transgene during ES cell differentiation. a: Expression of Flk1::H2B-EYFP during ES cell differentiation was examined by flow cytometry. The blue line in the histogram represents the Flk1::H2B-EYFP cells while the red line represents nontransgenic ES cells used as a control. The EYFP reporter was detected in undifferentiated ES cells. Strong expression of the H2B-EYFP fusion was maintained through day 2 and declined gradually over the next 4 days. b,c: The expression of hematopoietic/vascular markers on Flk1::H2B-EYFP+ cells was examined at day 4 (b) or day 6 (c). Cells from Flk1::H2B-EYFP EBs were stained with antibodies against Flk1, c-kit, and CD31 (see Materials and Methods). The EYFP-positive population was analyzed simultaneously for expression of endogenous Flk1, c-kit, or CD31 (PECAM-1). Significant populations of Flk1+c-kit+ and Flk1+CD31+ cells were detected on day 4 and increased by day 6 in culture, confirming that the EYFP-positive cells display surface properties of angioblastic/endothelial cells.
FIG. 3
FIG. 3
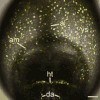
Expression of Flk1::H2B-EYFP in the early somite stage embryo. Anterior view of a 5-somite stage embryo enclosed in the yolk sac membranes. Strong nuclear yellow fluorescence is evident in the yolk sac (ys), developing heart crescent (ht), and paired dorsal aortae (da). al, allantois; am; amnion. Scale bar = 50 μm.
FIG. 4
FIG. 4
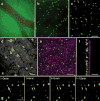
Expression of Flk1::H2B-EYFP in the yolk sac. a,b: Widefield images of an E9.5 yolk sac. Note that both the large vessel and capillaries are surrounded by EYFP-positive nuclei. A higher magnification view of capillaries is shown in b. c,d: Confocal images of E9.5 yolk sac. In d a confocal image was superimposed on a brightfield image; capillary edges can be seen. e,f: An E8.5 embryo with its extraembryonic membranes left intact was stained for 2 min in Draq5 then rinsed in PBS. Due to the brief period of staining, the dye penetrated only the outer visceral endoderm but not the mesodermal layer of the yolk sac. In e the yolk sac is shown en face along the plane of imaging. The 3D projection of z-stack was rotated 90° (f) to emphasize the specificity of the EYFP expression. g: 3D Time-lapse sequence showing the nucleus of a dividing cell in the yolk sac. Arrows indicate dividing cell (t = 0) or daughter cells (t = 4, 8, 12 min). Scale bars = 20 μm.
FIG. 5
FIG. 5
Expression of the H2B-EYFP fusion protein in E9.5 Flk1::H2B-EYFP transgenic embryos. Darkfield (a,c) and fluorescent (b,d) images of the same embryo. e: Magnified view of midbrain vasculature of E10.5 embryo, stereomicroscopic fluorescent image. f: 3D projection of confocal z-stack is shown for E9.5 midbrain vasculature. g,h: Stereomicroscopic fluorescent images of caudal end of E9.5 embryo. Intersomitic vessels (isv) are easily identified. i: 3D projections of z-stacks from confocal images of somitic vessels. Scale bars = 100 μm. uv, umbilical vessel (uv); hindlimb bud (lb).
FIG. 6
FIG. 6
Flk1::H2B-EYFP expression in organs from an E15.5 stage embryo. The fluorescent stereomicroscopic images are paired with darkfield (a,b,k) or brightfield (g,i) images. a,b: Heart (h) and lungs (l). c: Heart with high-magnification view (d) of epicardial vessels (boxed area in c). e,f: Forelimb. g,h: Ovary (ov) and mesonephros (mn). i,j: Kidney (k) and adrenal gland (ad). k,l: Stomach (st) and pancreas (p). ll, left lung; rl, right lung.
FIG. 7
FIG. 7
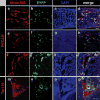
Immunostained sections from E15.5 Flk1::H2B-EYFP transgenic embryos. Expression of the H2B-EYFP fusion protein (b,f,j,n, detected here using an antibody against GFP; see Materials and Methods) overlapped with that of PECAM-1 (a,e,i; merged images, d,h,l), an endothelial marker. Erythroid cells (detected using anti-Ter119, m) filled spaces lined by H2B-EYFP-expressing endothelial cells (merged images, p). a–d: Section through gut; scale bar = 20 μm. e–h: Section through forelimb; scale bar = 20 μm. i–l: Section just below epidermis; scale bar = 10 μm. m–p: Section through dorsal trunk; scale bar = 50 μm.
FIG. 8
FIG. 8
Flk1::H2B-EYFP expression in adult tissues. a–c: Epifluorescence images of epicardial vessels of adult heart. Boxed area in a is shown magnified in b. The large vessels of the epicardium, most of which do not express the transgene, are easily seen (blue arrowheads). A larger fluorescent vessel is indicated by the white arrow. c: 3D projections of z-stacks from confocal images of peritoneal blood vessels. 3D projection of confocal z-stack of testis overlaid on bright field image. (d). Cytoplasm stained with Cell Tracker Orange. Interstitial capillary (ic); blood vessel (bv); seminiferous tubule (s). Scale bars = 100 μm.

References

    1. Anderson R, Copeland TK, Scholer H, Heasman J, Wylie C. The onset of germ cell migration in the mouse embryo. Mech Dev. 2000;91:61–68. - PubMed
    1. Bak M, Fraser SE. Axon fasciculation and differences in midline kinetics between pioneer and follower axons within commissural fascicles. Development. 2003;130:4999–5008. - PubMed
    1. Bautch VL, Ambler CA. Assembly and patterning of vertebrate blood vessels. Trends Cardiovasc Med. 2004;14:138–143. - PubMed
    1. Brown EB, Campbell RB, Tsuzuki Y, Xu L, Carmeliet P, Fukumura D, Jain RK. In vivo measurement of gene expression, angiogenesis and physiological function in tumors using multiphoton laser scanning microscopy. Nat Med. 2001;7:864–868. - PubMed
    1. Caprioli A, Zhu H, Sato TN. CRBP-III:lacZ expression pattern reveals a novel heterogeneity of vascular endothelial cells. genesis. 2004;40:139–145. - PubMed

MeSH terms