

Identifying differential expression in multiple SAGE libraries: an overdispersed log-linear model approach
- PMID: 15987513
- PMCID: PMC1189357
- DOI: 10.1186/1471-2105-6-165
Identifying differential expression in multiple SAGE libraries: an overdispersed log-linear model approach
Abstract
Background: In testing for differential gene expression involving multiple serial analysis of gene expression (SAGE) libraries, it is critical to account for both between and within library variation. Several methods have been proposed, including the t test, tw test, and an overdispersed logistic regression approach. The merits of these tests, however, have not been fully evaluated. Questions still remain on whether further improvements can be made.
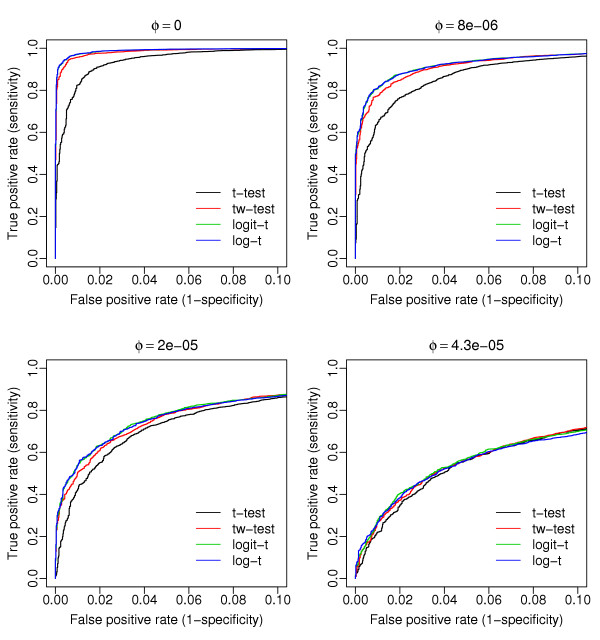
Results: In this article, we introduce an overdispersed log-linear model approach to analyzing SAGE; we evaluate and compare its performance with three other tests: the two-sample t test, tw test and another based on overdispersed logistic linear regression. Analysis of simulated and real datasets show that both the log-linear and logistic overdispersion methods generally perform better than the t and tw tests; the log-linear method is further found to have better performance than the logistic method, showing equal or higher statistical power over a range of parameter values and with different data distributions.
Conclusion: Overdispersed log-linear models provide an attractive and reliable framework for analyzing SAGE experiments involving multiple libraries. For convenience, the implementation of this method is available through a user-friendly web-interface available at http://www.cbcb.duke.edu/sage.
Figures


 ). The estimates are from the overdispersed log-linear model fit to the pancreas data. Tags with the overdispersion estimate 0 are not shown in the figure.
Similar articles
-
Overdispersed logistic regression for SAGE: modelling multiple groups and covariates.BMC Bioinformatics. 2004 Oct 6;5:144. doi: 10.1186/1471-2105-5-144. BMC Bioinformatics. 2004. PMID: 15469612 Free PMC article.
-
Statistical evaluation of SAGE libraries: consequences for experimental design.Physiol Genomics. 2002 Oct 29;11(2):37-44. doi: 10.1152/physiolgenomics.00042.2002. Physiol Genomics. 2002. PMID: 12407185 Review.
-
Highly expressed genes in pancreatic ductal adenocarcinomas: a comprehensive characterization and comparison of the transcription profiles obtained from three major technologies.Cancer Res. 2003 Dec 15;63(24):8614-22. Cancer Res. 2003. PMID: 14695172
-
Statistical modeling of sequencing errors in SAGE libraries.Bioinformatics. 2004 Aug 4;20 Suppl 1:i31-9. doi: 10.1093/bioinformatics/bth924. Bioinformatics. 2004. PMID: 15262778
-
[Transcriptomes for serial analysis of gene expression].J Soc Biol. 2002;196(4):303-7. J Soc Biol. 2002. PMID: 12645300 Review. French.
Cited by
-
Statistical design and analysis of RNA sequencing data.Genetics. 2010 Jun;185(2):405-16. doi: 10.1534/genetics.110.114983. Epub 2010 May 3. Genetics. 2010. PMID: 20439781 Free PMC article.
-
Statistical methods for detecting differentially abundant features in clinical metagenomic samples.PLoS Comput Biol. 2009 Apr;5(4):e1000352. doi: 10.1371/journal.pcbi.1000352. Epub 2009 Apr 10. PLoS Comput Biol. 2009. PMID: 19360128 Free PMC article.
-
Social disparities in the use of colonoscopy by primary care physicians in Ontario.BMC Gastroenterol. 2011 Sep 28;11:102. doi: 10.1186/1471-230X-11-102. BMC Gastroenterol. 2011. PMID: 21955593 Free PMC article.
-
ProbFAST: Probabilistic functional analysis system tool.BMC Bioinformatics. 2010 Mar 30;11:161. doi: 10.1186/1471-2105-11-161. BMC Bioinformatics. 2010. PMID: 20353576 Free PMC article.
-
CAMDA 2023: Finding patterns in urban microbiomes.Front Genet. 2024 Nov 25;15:1449461. doi: 10.3389/fgene.2024.1449461. eCollection 2024. Front Genet. 2024. PMID: 39655221 Free PMC article.
References
-
- Velculescu VE, Zhang L, Vogelstein B, Kinzler KW. Serial analysis of gene expression.[comment] Science. 1995;270:484–487. - PubMed
-
- Porter D, Lahti-Domenici J, Keshaviah A, Bae YK, Argani P, Marks J, Richardson A, Cooper A, Strausberg R, Riggins GJ, Schnitt S, Gabrielson E, Gelman R, Polyak K. Molecular markers in ductal carcinoma in situ of the breast. Molecular Cancer Research: MCR. 2003;1:362–375. - PubMed
-
- Audic S, Claverie JM. The significance of digital gene expression profiles. Genome Research. 1997;7:986–995. - PubMed
Publication types
MeSH terms
Substances
Grants and funding
LinkOut - more resources
Full Text Sources
