. 2005 Jun 29;25(26):6235-42.
doi: 10.1523/JNEUROSCI.1478-05.2005.

Dopamine cells respond to predicted events during classical conditioning: evidence for eligibility traces in the reward-learning network

Affiliations

Dopamine cells respond to predicted events during classical conditioning: evidence for eligibility traces in the reward-learning network

Wei-Xing Pan et al. J Neurosci. .

Abstract

Behavioral conditioning of cue-reward pairing results in a shift of midbrain dopamine (DA) cell activity from responding to the reward to responding to the predictive cue. However, the precise time course and mechanism underlying this shift remain unclear. Here, we report a combined single-unit recording and temporal difference (TD) modeling approach to this question. The data from recordings in conscious rats showed that DA cells retain responses to predicted reward after responses to conditioned cues have developed, at least early in training. This contrasts with previous TD models that predict a gradual stepwise shift in latency with responses to rewards lost before responses develop to the conditioned cue. By exploring the TD parameter space, we demonstrate that the persistent reward responses of DA cells during conditioning are only accurately replicated by a TD model with long-lasting eligibility traces (nonzero values for the parameter lambda) and low learning rate (alpha). These physiological constraints for TD parameters suggest that eligibility traces and low per-trial rates of plastic modification may be essential features of neural circuits for reward learning in the brain. Such properties enable rapid but stable initiation of learning when the number of stimulus-reward pairings is limited, conferring significant adaptive advantages in real-world environments.


Figures
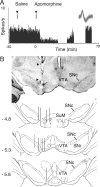
Figure 1.
Figure 1.
Identification of DA cells. A, Electrophysiological and pharmacological criteria. Rate meter histogram shows low baseline firing rate, lack of response to control saline injection, and inhibitory response of a typical presumed DA neuron to injection of apomorphine (750 μg/kg, i.p.). Gaps in histogram are periods during which recording was suspended. Inset shows overlaid recorded waveforms from this cell, 2 ms total time. B, Location of recorded cells. Histological section shows a cannula track (arrowheads) approaching midbrain DA cell fields and marking lesion (arrow) at the site of recording of a presumed DA neuron. Atlas section diagrams (Paxinos and Watson, 1997) show reconstructed positions of all tracks on which DA cells were recorded (anteroposterior coordinate in mm, relative to bregma, at left). Some tracks yielded more than one cell. SNc, Substantia nigra pars compacta; SNr, substantia nigra pars reticulata; SuM, supramammillary nucleus; VTA, ventral tegmental area.
Figure 2.
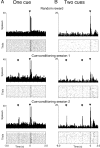
Figure 2.
Development of conditioned responses to cues in two different DA neurons. A, DA neuron conditioned with a single tone cue. The top histogram and dot raster show average and trial-by-trial responses to solenoid (filled triangle) in random-reward paradigm. The dot raster shows time of action potentials on individual trials, in original order, first trial at the bottom. The middle and bottom histograms and rasters show the responses of the cell in successive conditioning blocks in which the solenoid was paired with the cue (onset at double arrowhead). B, DA cell conditioned with the two-cue paradigm. Panel layout and labels as for A. Neither cell responded to cues before conditioning (data not shown).
Figure 3.
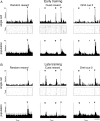
Figure 3.
Effect of training on responses of DA cells to reward delivery under different states of predictability. A, Data from animals early (≤6 blocks) in training. The top histograms and dot rasters show a single example cell (same cell as Fig. 2 A) in the random-reward paradigm (left), cued-reward trials from within the omission paradigm (middle), and omit cue 2 trials of the omission paradigm (right). Population histograms below the rasters were calculated by averaging 50 ms bin counts across all individual histograms (n = 6, 8, and 3, respectively) and converting to instantaneous frequency. Error bars represent SEM. B, Data from animals that had been exposed to ≥10 blocks of conditioning (late training). Panel layout and labels as for A. Population histograms were constructed from five, five, and four individual histograms, respectively. Horizontal calibration bar shows 0.5 s for all panels except the example cell data in A (2 s). Asterisks show time at which cue 2 would normally occur (omit cue 2 trials).
Figure 4.
Figure 4.
TD models of DA cell activity during learning. A, Simplified network diagram summarizing main features of the TD model. Each sensory signal Sl is represented by a state vector xl, which encodes the signal over time (curved arrows). At any time step t, output of the state vector gives rise to a prediction P(t), which depends on the weight wl(t) of the component representing the signal at that time. Component weights are eligible for modification after the occurrence of Sl, depending on the value of the eligibility trace el(t). Predictions at time step t are subtracted from the prediction of the previous time step to generate the temporal difference [TD(t)]. The TD output is compared with the value of the reward signal r(t) to generate the prediction error δ(t), equated with DA cell activity. This then modifies weights of the state vector xl representing Sl depending on their eligibility and the learning rate (α). B, Surface plot shows TD prediction error amplitude (vertical axis) during each trial, over the course of learning (400 trials), with λ = 0 and α = 0.05. Grid lines show each time step on every 10th trial. Cues were delivered at time step 5 and 15 and reward at time step 20. Line graphs show prediction error profiles of single trials from the positions on the surface indicated by the arrows, before training (bottom), early in training (middle), and late in training (top). C, Surface plot and single trials for TD learning with λ = 0.9 and α = 0.005 (500 trials). Surface grid lines show every 10th trial. D, Population data from DA cell recordings. The same data from Figure 3A (animals with little training) and Figure 3B (animals with more extensive training) have been replotted as line graphs, after normalizing for different firing rate by converting to modulation index (see Materials and Methods) and smoothing by a three-step running average. The bottom plot shows responses to unpredicted rewards of both early and late training groups overlaid. The middle plot shows data from cells recorded in animals in early training and top plot data from different cells recorded in animals late in training. It is clear that the cell data matches well the model profiles in C but not those generated by the parameters used in B. Calibration bar, 500 ms.
Figure 5.
Figure 5.
Exploration of the parameter space of the TD algorithm. Each 3-D surface plot shows changes in prediction error output over the course of conditioning for a different value of α and λ. Cues were delivered at time steps 5 and 15 and reward at time step 20. The number of trials shown in each plot (n) was varied for different settings of α, so that similar levels of learning were obtained by the end of the simulation.
Figure 6.
Figure 6.
TD modeling of the response of DA cells to omission of an expected intermediate cue signal. A, Prediction error outputs from successive single trials of TD model (λ = 0.9; α = 0.005), in which the second cue was either present (solid lines) or omitted (dotted lines). The two lines completely overlap except at times of cue 2 and reward. The top graph shows trial from early in training (trials 100 and 101) and bottom graph from late in training (trials 400 and 401). The calibration bar indicates five time steps. B, DA cell population data for the early and late training groups from Figure 3, normalized and smoothed as described in the legend for Figure 4. Solid lines show population histograms derived from cued-reward trials within the omission paradigm. Dotted lines show response to cue 2 omission within the same omission paradigm block for the same cells. Calibration, 500 ms.

References

    1. Aebischer P, Schultz W (1984) The activity of pars compacta neurons of the monkey substantia nigra is depressed by apomorphine. Neurosci Lett 50: 25-29. - PubMed
    1. Aghajanian GK, Bunney BS (1977) Dopamine “autoreceptors”: pharmacological characterization by microiontophoretic single cell recording studies. Naunyn Schmiedebergs Arch Pharmacol 297: 1-7. - PubMed
    1. Barto AG (1995) Adaptive critics and the basal ganglia. In: Models of information processing in the basal ganglia (Houk JC, Davis JL, Beiser DG, eds), pp 215-232. Cambridge, MA: MIT.
    1. Barto AG, Sutton RS (1982) Simulation of anticipatory responses in classical-conditioning by a neuron-like adaptive element. Behav Brain Res 4: 221-235. - PubMed
    1. Bunney BS, Aghajanian GK, Roth RH (1973) Comparison of effects of l-dopa, amphetamine and apomorphine on firing rate of rat dopaminergic neurones. Nat New Biol 245: 123-125. - PubMed

Publication types

LinkOut - more resources