. 2005 Jul;25(14):5933-46.
doi: 10.1128/MCB.25.14.5933-5946.2005.

Nrf1 and Nrf2 regulate rat glutamate-cysteine ligase catalytic subunit transcription indirectly via NF-kappaB and AP-1

Affiliations

Nrf1 and Nrf2 regulate rat glutamate-cysteine ligase catalytic subunit transcription indirectly via NF-kappaB and AP-1

Heping Yang et al. Mol Cell Biol. 2005 Jul.

Abstract

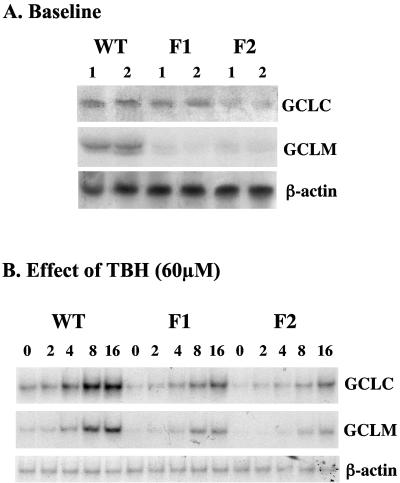
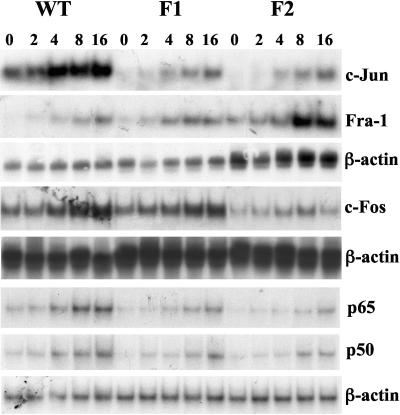
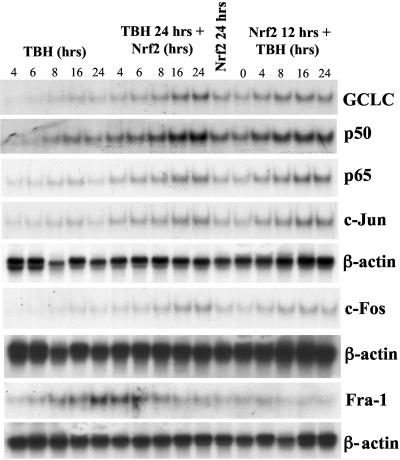
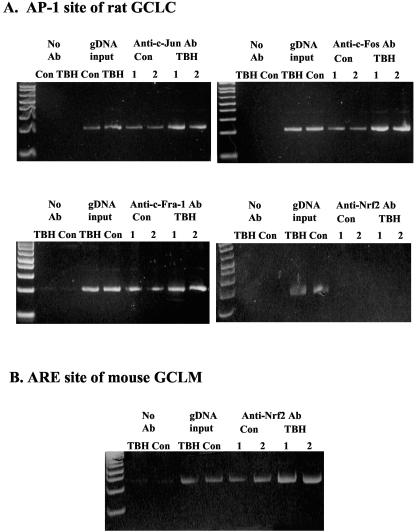
Glutamate-cysteine ligase catalytic subunit (GCLC) is regulated transcriptionally by Nrf1 and Nrf2. tert-Butylhydroquinone (TBH) induces human GCLC via Nrf2-mediated trans activation of the antioxidant-responsive element (ARE). Interestingly, TBH also induces rat GCLC, but the rat GCLC promoter lacks ARE. This study examined the role of Nrf1 and Nrf2 in the transcriptional regulation of rat GCLC. The baseline and TBH-mediated increase in GCLC mRNA levels and rat GCLC promoter activity were lower in Nrf1 and Nrf2 null (F1 and F2) fibroblasts than in wild-type cells. The basal protein and mRNA levels and nuclear binding activities of c-Jun, c-Fos, p50, and p65 were lower in F1 and F2 cells and exhibited a blunted response to TBH. Lower c-Jun and p65 expression also occurs in Nrf2 null livers. Levels of other AP-1 and NF-kappaB family members were either unaffected (i.e., JunB) or increased (i.e., Fra-1). Overexpression of Nrf1 and Nrf2 in respective cells restored the rat GCLC promoter activity and response to TBH but not if the AP-1 and NF-kappaB binding sites were mutated. Fra-1 overexpression lowered endogenous GCLC expression and rat GCLC promoter activity, while Fra-1 antisense had the opposite effects. In conclusion, Nrf1 and Nrf2 regulate rat GCLC promoter by modulating the expression of key AP-1 and NF-kappaB family members.


Figures

FIG. 1.
FIG. 1.
GCL subunit expression at baseline and in response to TBH in WT, F1, and F2 cells. RNA (25 μg/lane) samples from WT, F1, and F2 cells at baseline (A) or treated with 60 μM TBH for 0 to 16 h (B) were analyzed by Northern blot analysis with a 32P-labeled GCLC cDNA probe as described in Materials and Methods. The same membranes were then sequentially rehybridized with 32P-labeled GCLM and β-actin cDNA probes.
FIG. 2.
FIG. 2.
Effect of TBH on rat GCLC promoter activity in WT, F1, and F2 cells. WT, F1, and F2 cells were transiently transfected with the rat GCLC promoter-luciferase construct −595/+2-LUC (labeled GCLC-LUC) or pGL-3 enhancer vector and treated with TBH (60 μM for 8 h) or vehicle control (DMSO) as described in Materials and Methods. Results represent the mean ± SEM from three independent experiments performed in triplicate. Data are expressed as relative luciferase activity to that of pGL-3 enhancer vector control in WT cells, which is assigned a value of 1.0. *, P < 0.05 versus WT GCLC-LUC; †, P < 0.05 versus respective control and WT GCLC-LUC plus TBH (ANOVA followed by Fisher's test).
FIG. 3.
FIG. 3.
Steady-state protein levels of the AP-1 family members in WT, F1, and F2 cells. Total cell lysates (40 μg/lane) from WT, F1, and F2 cells were subjected to Western blot analysis using anti-c-Fos, c-Jun, phospho-c-Jun (p-c-Jun), JunB, JunD, Fra-1, Fra-2, and JAB1 antibodies as described in Materials and Methods. The same membranes were stripped and probed with antibodies against actin to ensure equal protein loading. The right panels show densitometric changes expressed as percentages of WT. *, P < 0.05 versus WT. Representative blots are shown.
FIG. 4.
FIG. 4.
Steady-state protein levels of the NF-κB family members in WT, F1, and F2 cells. Total cell lysates (40 μg/lane) from WT, F1, and F2 cells were subjected to Western blot analysis using anti-p50, p65, RelB, and c-Rel antibodies as described in Materials and Methods. The same membranes were stripped and probed with antibodies against actin to ensure equal protein loading. The right panels show densitometric changes expressed as percentages of WT. *, P < 0.05 versus WT. Representative blots are shown.
FIG. 5.
FIG. 5.
Effect of TBH on c-Jun, Fra-1, c-Fos, p65, and p50 mRNA levels in WT, F1, and F2 cells. RNA (25 μg/lane) samples from WT, F1, and F2 cells treated with 60 μM TBH for 0 to 16 h were analyzed by Northern blot analysis with 32P-labeled c-Jun, c-Fos, or p65 cDNA probes as described in Materials and Methods. The same membranes were then sequentially rehybridized with 32P-labeled Fra-1 and β-actin cDNA probes, β-actin cDNA probe, or p50 and β-actin cDNA probes, respectively.
FIG. 6.
FIG. 6.
Effect of TBH on electrophoretic mobility shift and supershift assays for AP-1 binding. Nuclear protein extracts (10 μg) were obtained from WT, F1, and F2 cells treated with TBH (60 μM for 0, 4, or 8 h), and EMSA was done as described in Materials and Methods using a consensus AP-1 probe. Panel A shows supershift analysis using anti-c-Jun antibodies, and panel B shows supershift analysis using anti-c-Fos antibodies. The arrows to the right point to complexes that were supershifted in the presence of specific antibodies. Representative EMSAs are shown.
FIG. 7.
FIG. 7.
Effect of TBH on electrophoretic mobility shift and supershift assays for NF-κB binding. Nuclear protein extracts (10 μg) were obtained from WT, F1, and F2 cells treated with TBH (60 μM for 0, 4, or 8 h), and EMSA was done as described in Materials and Methods using a consensus NF-κB probe. Panel A shows supershift analysis using anti-p65 antibodies, and panel B shows supershift analysis using anti-p50 antibodies. The arrows to the right point to complexes that were supershifted in the presence of specific antibodies.
FIG. 8.
FIG. 8.
Real-time PCR analysis of hepatic c-Jun, p65, and GCLC mRNA levels in Nrf2 knockout mice and wild-type littermates. RNA was extracted from the livers of wild-type and Nrf2 knockout mice and subjected to real-time PCR as described in Materials and Methods. Results represent means ± standard deviation from three animals each relative to wild-type mice. Expression levels were calculated relative to 18S rRNA levels as endogenous control. *, P < 0.005 versus wild type.
FIG. 9.
FIG. 9.
Effect of Nrf2 overexpression and TBH treatment on the steady-state mRNA levels of GCLC, p50, p65, c-Jun, c-Fos, and Fra-1 in F2 cells. F2 cells were treated with either 60 μM TBH for 4 to 24 h (lanes 1 to 5 from the left), 60 μM TBH for 24 h plus Nrf2 expression vector during the last 4 to 24 h of the TBH treatment (lanes 6 to 10 from the left), Nrf2 expression vector alone for 24 h (lane 11 from the left), or Nrf2 expression vector for 12 h followed by 60 μM TBH for 0 to 24 h (lanes 12 to 16 from the left). RNA (25 μg/lane) samples following these treatments were analyzed by Northern blot analysis with 32P-labeled GCLC, p50, p65, c-Jun, c-Fos, and Fra-1 cDNA probes as described in Materials and Methods. β-Actin was used for housekeeping control.
FIG. 10.
FIG. 10.
Effect of Nrf2/Nrf1 overexpression and/or TBH treatment on rat GCLC, human c-Jun, and mouse c-Fos promoter activities and c-Jun and NF-κB-dependent reporter activities. (A) F2 cells were transiently transfected with the rat native or mutant GCLC promoter-luciferase construct −595/+2-LUC (GCLC-LUC) or pGL-3 enhancer vector and treated with TBH (60 μM for 8 h) plus empty vector, Nrf2 expression vector, or TBH plus Nrf2 expression vector as described in Materials and Methods. To assess the importance of the AP-1 and NF-κB binding sites, these sites were mutated by two bases as described in Materials and Methods. The effect of Nrf2 overexpression and TBH was examined in the mutant constructs containing only the mutated AP-1 site (AP-1mut), only the mutated NF-κB site (NFκBmut), or both. Results represent means ± SEM from four independent experiments performed in triplicates. Data are expressed as luciferase activity relative to that of pGL-3 enhancer vector, which is assigned a value of 1.0. *, P < 0.05 versus native GCLC-LUC construct; **, P < 0.05 versus native GCLC-LUC construct and treatment with either TBH or Nrf2 expression vector; †, P < 0.05 versus native construct treated with Nrf2 expression vector and TBH (ANOVA followed by Fisher's test). (B) F2 cells were cotransfected with c-Jun or c-Fos promoter constructs (c-Jun-LUC or c-Fos-LUC), c-Jun- or NF-κB-dependent constructs (Jun2-LUC or NFκB-LUC), and Nrf2 expression vector or empty vector control as described in Materials and Methods. Results represent means ± SEM from three to four independent experiments performed in triplicates. Data are expressed relative to activities without Nrf2 (empty vector control). *, P < 0.05 versus without Nrf2. (C) F1 cells were transiently transfected with the rat native or mutant GCLC promoter-luciferase construct −595/+2-LUC (GCLC-LUC) or pGL-3 enhancer vector and treated with empty vector or Nrf1 expression vector as described in Materials and Methods. Results represent means ± SEM from four independent experiments performed in triplicates. Data are expressed as luciferase activity relative to that of pGL-3 enhancer vector, which is assigned a value of 1.0. *, P < 0.05 versus native GCLC-LUC construct; †, P < 0.05 versus native construct and native construct treated with Nrf1 expression vector (ANOVA followed by Fisher's test).
FIG. 11.
FIG. 11.
EMSA and supershift analysis of the rat GCLC AP-1 and NF-κB sites. WT cells were treated with TBH (60 μM for 8 h) or vehicle control and subjected to EMSA with supershift analysis for the AP-1 site at −356 or the NF-κB site at −378. Supershift analysis was performed using antibodies directed against c-Jun, Nrf1, and Nrf2 for the AP-1 site (A) and p50, Nrf1, and Nrf2 for the NF-κB site (B). Note that supershift occurred only with anti-c-Jun antibodies for the AP-1 site and anti-p50 antibodies for the NF-κB site. As a positive control, TBH treatment induced Nrf1 and Nrf2 binding to the ARE site of the mouse GCLM (C). Arrows in panel C point to the Nrf1 and Nrf2 supershifts.
FIG. 12.
FIG. 12.
Effect of Fra-1 or Fra-1 antisense overexpression on the endogenous GCLC expression (A) or rat GCLC promoter activity (B). (A) F2 cells were treated with Fra-1 or Fra-1 antisense expression vector for 12 h, and RNA (25 μg/lane) samples following these treatments were analyzed by Northern blot analysis with a 32P-labeled GCLC cDNA probe as described in Materials and Methods. β-Actin was used for housekeeping control. (B) F2 cells were transiently transfected with the rat GCLC promoter-luciferase construct −595/+2-LUC (GCLC-LUC) and treated with TBH (60 μM for 8 h) plus empty vector, Nrf2 expression vector, Fra-1 expression vector, Fra-1 antisense expression vector (Fra-1 AS), or a combination of Nrf2 and TBH, Fra-1 and TBH, or Fra-1 AS and TBH as described in Materials and Methods. Results represent means ± SEM from six independent experiments performed in triplicates. Data are expressed as luciferase activity relative to that of pGL-3 enhancer vector, which is assigned a value of 1.0. *, P < 0.01 versus GCLC-LUC construct; †, P < 0.05 versus GCLC-LUC construct; **, P < 0.005 versus GCLC-LUC construct and treatment with either TBH, Nrf2, or Fra-1 AS expression vectors (ANOVA followed by Fisher's test).
FIG. 13.
FIG. 13.
Effect of TBH treatment on protein binding to the rat GCLC AP-1 site in vivo. ChIP assay was used to assess transcription factor binding to the AP-1 site of rat GCLC in an endogenous chromatin configuration as described in Materials and Methods. Note that TBH treatment increased c-Jun, c-Fos, and Fra-1 binding to the rat GCLC AP-1 site. Nrf2 does not bind to this site, but increased binding to the ARE site of mouse GCLM can be seen following TBH treatment.

Similar articles

Cited by

References

    1. Chan, J. Y., and M. Kwong. 2000. Impaired expression of glutathione synthetic enzyme genes in mice with targeted deletion of the Nrf2 basic-leucine zipper protein. Biochim. Biophys. Acta 1517:19-26. - PubMed
    1. Chan, K., X. D. Han, and Y. W. Kan. 2001. An important function of Nrf2 in combating oxidative stress: detoxification of acetaminophen. Proc. Natl. Acad. Sci. USA 98:4611-4616. - PMC - PubMed
    1. Chen, L., M. Kwong, R. Lu, D. Ginzinger, C. Lee, L. Leung, and J. Y. Chan. 2003. Nrf1 is critical for redox balance and survival of liver cells during development. Mol. Cell. Biol. 23:4673-4686. - PMC - PubMed
    1. Erickson, A. M., Z. Nevarea, J. J. Gipp, and R. T. Mulcahy. 2002. Identification of a variant antioxidant response element in the promoter of the human glutamate-cysteine ligase modifier subunit gene. J. Biol. Chem. 277:30730-30737. - PubMed
    1. Galloway, D. C., D. G. Blake, A. G. Shepherd, and L. I. McLellan. 1997. Regulation of human γ-glutamylcysteine synthetase: co-ordinate induction of the catalytic and regulatory subunits in HepG2 cells. Biochem. J. 328:99-104. - PMC - PubMed

Publication types

MeSH terms