. 2005 Jul;25(14):6031-46.
doi: 10.1128/MCB.25.14.6031-6046.2005.

Reciprocal transcriptional regulation of Pou5f1 and Sox2 via the Oct4/Sox2 complex in embryonic stem cells

Affiliations

Reciprocal transcriptional regulation of Pou5f1 and Sox2 via the Oct4/Sox2 complex in embryonic stem cells

Joon-Lin Chew et al. Mol Cell Biol. 2005 Jul.

Abstract

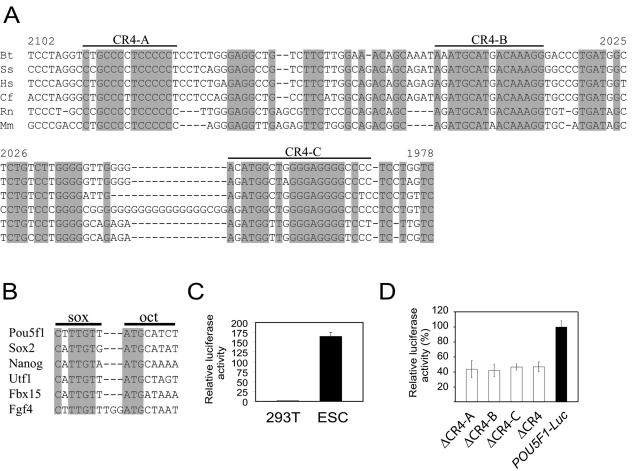
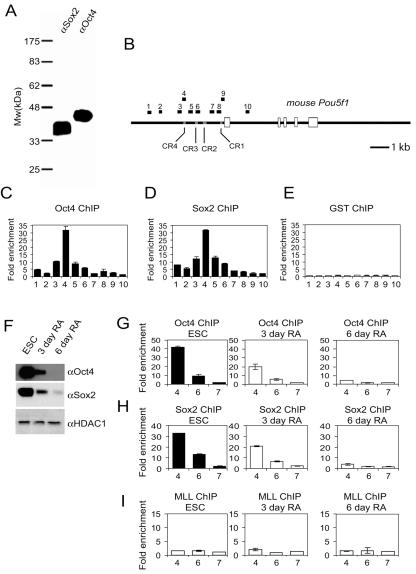
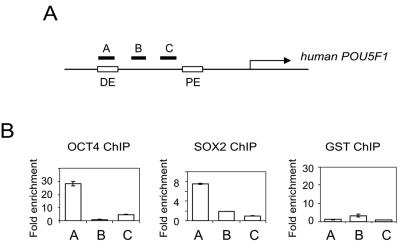
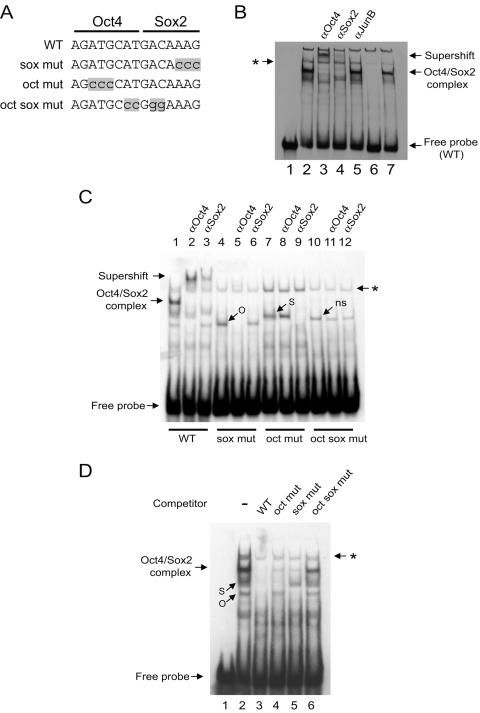
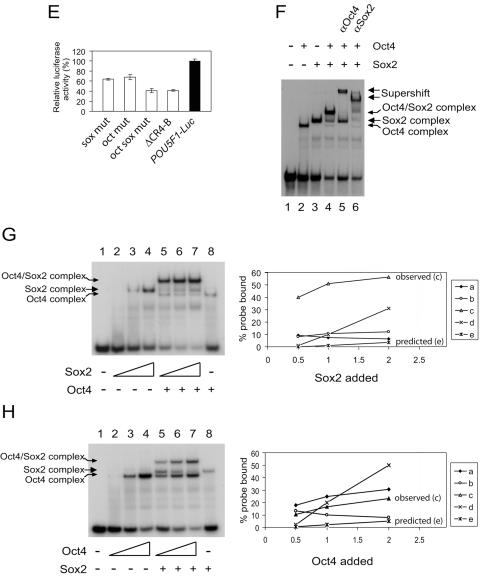
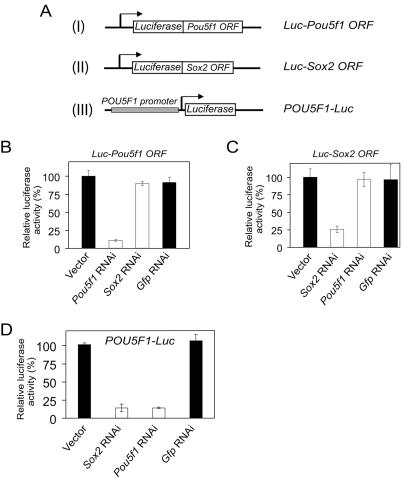
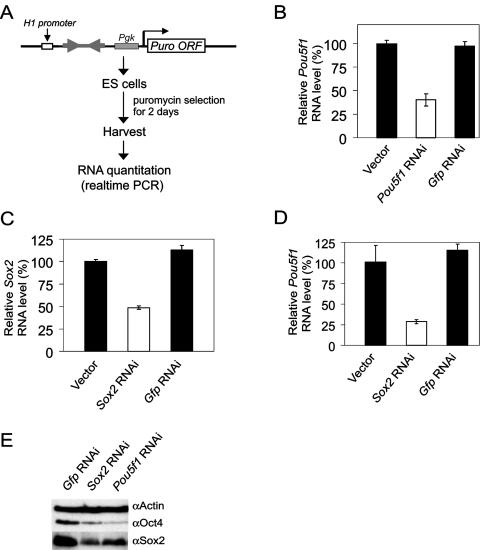
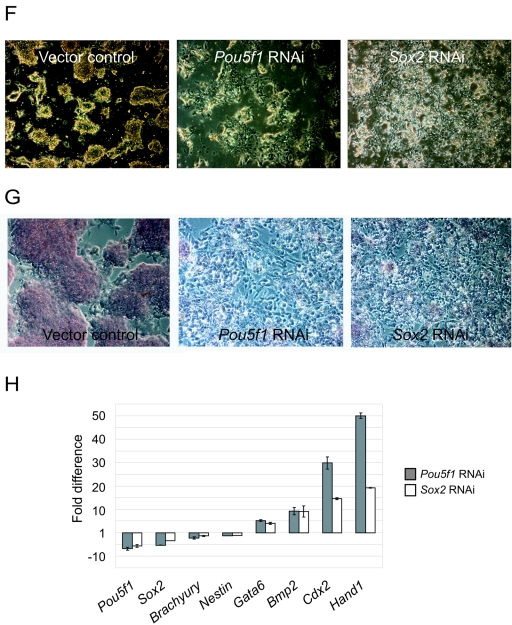
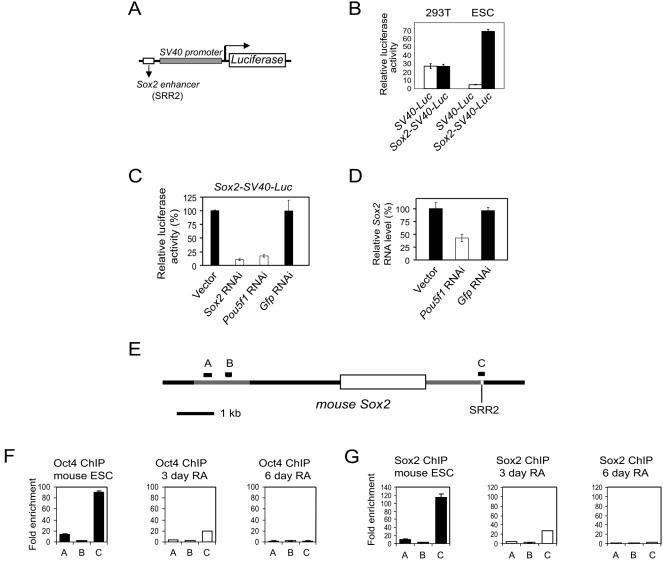
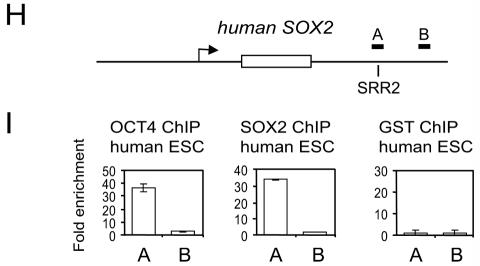
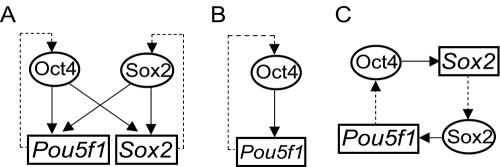
Embryonic stem cells (ESCs) are pluripotent cells that can either self-renew or differentiate into many cell types. Oct4 and Sox2 are transcription factors essential to the pluripotent and self-renewing phenotypes of ESCs. Both factors are upstream in the hierarchy of the transcription regulatory network and are partners in regulating several ESC-specific genes. In ESCs, Sox2 is transcriptionally regulated by an enhancer containing a composite sox-oct element that Oct4 and Sox2 bind in a combinatorial interaction. It has previously been shown that Pou5f1, the Oct4 gene, contains a distal enhancer imparting specific expression in both ESCs and preimplantation embryos. Here, we identify a composite sox-oct element within this enhancer and show that it is involved in Pou5f1 transcriptional activity in ESCs. In vitro experiments with ESC nuclear extracts demonstrate that Oct4 and Sox2 interact specifically with this regulatory element. More importantly, by chromatin immunoprecipitation assay, we establish that both Oct4 and Sox2 bind directly to the composite sox-oct elements in both Pou5f1 and Sox2 in living mouse and human ESCs. Specific knockdown of either Oct4 or Sox2 by RNA interference leads to the reduction of both genes' enhancer activities and endogenous expression levels in addition to ESC differentiation. Our data uncover a positive and potentially self-reinforcing regulatory loop that maintains Pou5f1 and Sox2 expression via the Oct4/Sox2 complex in pluripotent cells.


Figures

FIG. 1.
FIG. 1.
(A) Conserved motifs within the distal enhancer of Pou5f1. Alignment of the CR4 region of Pou5f1 from genomic sequence from six eutherian mammals: Bos taurus (Bt), Sus scrofa (Ss), Homo sapiens (Hs), Canus familiaris (Cf), Rattus norvegicus (Rn), and Mus musculus (Mm). Invariant positions within this alignment are indicated by a shaded box. The numbering corresponds to the mouse sequence (Mm) and is relative to the translation start site. CR4-A, -B, and -C are regions discussed in the text. (B) Alignment of the composite sox-oct cis elements from the respective mouse target genes that are known to bind Sox2 and Oct4, including that described in this paper and present in the CR4-B region in panel A (complementary strand). (C) The 3-kb human POU5F1 promoter drives luciferase expression specific to ESC. (D) The effects of deleting the specific CR4-A, CR4-B, and CR4-C regions highlighted in panel A and of the deletion of the entire CR4 region, in the context of the 3-kb human POU5F1 promoter, on luciferase reporter activity in mouse ESCs. Activity is expressed relative to the wild-type construct (POU5F1-Luc).
FIG. 2.
FIG. 2.
Oct4 and Sox2 bind to the distal enhancer of Pou5f1 in living mouse ESCs. (A) Specificity of the antibodies used in the ChIP assays was confirmed by Western blotting of mouse ESC nuclear extracts. (B) The locations of the amplified products (black boxes) of the primer sets used to detect the ChIP-enriched DNA fragments, shown within the context of the genomic structure of mouse Pou5f1. The locations of the conserved regions within the promoter are indicated. The composite sox-oct element is within CR4. Amplicons are numbered in order relative to their sites along the gene. Open boxes represent exons. (C to E) High-resolution mapping of Oct4 (C), Sox2 (D), and control (glutathione S-transferase antibody [GST]) (E) binding sites across the Pou5f1 promoter in mouse ESCs by ChIP analysis. Fold enrichment is the relative abundance of DNA fragments at the indicated regions (see panel B) over a control region as quantified by real-time PCR. Standard deviations are shown. (F to I) A similar analysis of Oct4 (G) and Sox2 (H) occupancy on the Pou5f1 promoter in undifferentiated mouse ESCs and in ESCs induced to differentiate with RA for 3 and 6 days. Oct4 and Sox2 levels are shown to decrease in these differentiating conditions as identified by Western blotting (F) with a histone deacetylase 1 antibody (αHDAC1) used as a loading control. ChIP analysis was used as a subset (4, 6, and 7) of the amplicons described in panel B. (I) A control ChIP assay using an anti-MLL antibody.
FIG. 3.
FIG. 3.
OCT4 and SOX2 bind to the distal enhancer/CR4 region of POU5F1 in living human ESCs. (A) Schematic of the location of the amplicons (A, B, and C) used to detect ChIP-enriched fragments in POU5F1 shown relative to the distal enhancer (DE)/CR4 region in which the composite sox-oct element resides, to the proximal enhancer (PE), and to the transcription start site (arrow). (B) Real-time PCR detection of enriched fragments from ChIP assays using OCT4, SOX2, and a control glutathione S-transferase (GST) antibody.
FIG. 4.
FIG. 4.
Oct4 and Sox2 bind to the composite sox-oct element in POU5F1. EMSAs were used to analyze the interactions between native Oct4 and Sox2 with a 42-bp double-stranded DNA probe containing the composite sox-oct element. (A) Sequence of the composite element and corresponding mutations (lowercase and shaded) used in this study. (B) EMSA with the wild-type probe detected a specific Oct4 and Sox2 complex. Lane 1 is without nuclear extract; all other lanes are with 15 μg nuclear extract; lanes 3 through 5 are with the respective antibodies added; lane 6 is with 200-fold excess cold probe; lane 7 is with 200-fold excess cold nonspecific probe. The asterisk denotes nonspecific complex associated with all four probes which cannot be competed out by an excess of nonspecific probe. (C) EMSA with probes containing mutations as shown in panel A. O indicates Oct4/DNA binary specific complex, while S indicates Sox2/DNA binary complex. The asterisk denotes nonspecific complex associated with all four probes which cannot be competed out by an excess of nonspecific probe. “ns” denotes a complex which cannot be supershifted with either Oct4 or Sox2 antibodies. (D) EMSAs with the wild-type probe were performed in the presence of excess cold probes (WT, oct mut, sox mut, or oct sox mut). WT, wild type. O, S, and the asterisk are as defined for panel C. (E) The same mutations described in panel A were tested for promoter activity within the context of the 3-kb POU5F1 promoter driving a luciferase reporter. These constructs were transfected into mouse ESCs and tested for luciferase activity 2 days later. Activity is expressed relative to the wild-type promoter (POU5F1-Luc). The CR4-B-deleted construct (Fig. 1) is included for comparison. (F) EMSA using overexpressed Oct4 or Sox2. Whole-cell lysates from 293T cellstransfected with Pou5f1 or Sox2 expression constructs were used in EMSAs. Oct4 and Sox2 are capable of forming specific complexes as confirmed by supershift analysis. (G) Analysis of the cooperativity of Sox2 and Oct4 binding to the composite sox-oct element. An increasing concentration of Sox2 was added to the probe in the absence or presence of a fixed amount of Oct4 (left panel). Quantitative representation of the DNA binding data is presented in the right panel (a, Oct4/DNA complex in the presence of Sox2, lanes 5 to 7; b, Sox2/DNA complex in the presence of Oct4, lanes 5 to 7; c, Oct4/Sox2/DNA complex, lanes 5 to 7; d, Sox2-DNA complex in the absence of Oct4, lanes 2 to 4; e, predicted amount of Oct4/Sox2/DNA complex if Oct4 and Sox2 bind independently of each other and show no cooperativity). The x axis represents the different amounts (microliters) of Sox2 added to the EMSA reaction mixtures. The amount of probe present was determined by PhosphorImager analysis and expressed as the percentage of total probe for each sample (y axis, percent probe bound). (H) Analysis of the cooperativity of Oct4 and Sox2 binding to the composite sox-oct element. Oct4 was titrated with a fixed amount of Sox2. Quantitative representation of the DNA binding data is presented in the right panel (a, Oct4/DNA complex in the presence of Sox2, lanes 5 to 7; b, Sox2/DNA complex in the presence of Oct4, lanes 5 to 7; c, Oct4/Sox2/DNA complex, lanes 5 to 7; d, Oct4-DNA complex in the absence of Sox2, lanes 2 to 4; e, predicted amount of Oct4/Sox2/DNA complex).
FIG. 4.
FIG. 4.
Oct4 and Sox2 bind to the composite sox-oct element in POU5F1. EMSAs were used to analyze the interactions between native Oct4 and Sox2 with a 42-bp double-stranded DNA probe containing the composite sox-oct element. (A) Sequence of the composite element and corresponding mutations (lowercase and shaded) used in this study. (B) EMSA with the wild-type probe detected a specific Oct4 and Sox2 complex. Lane 1 is without nuclear extract; all other lanes are with 15 μg nuclear extract; lanes 3 through 5 are with the respective antibodies added; lane 6 is with 200-fold excess cold probe; lane 7 is with 200-fold excess cold nonspecific probe. The asterisk denotes nonspecific complex associated with all four probes which cannot be competed out by an excess of nonspecific probe. (C) EMSA with probes containing mutations as shown in panel A. O indicates Oct4/DNA binary specific complex, while S indicates Sox2/DNA binary complex. The asterisk denotes nonspecific complex associated with all four probes which cannot be competed out by an excess of nonspecific probe. “ns” denotes a complex which cannot be supershifted with either Oct4 or Sox2 antibodies. (D) EMSAs with the wild-type probe were performed in the presence of excess cold probes (WT, oct mut, sox mut, or oct sox mut). WT, wild type. O, S, and the asterisk are as defined for panel C. (E) The same mutations described in panel A were tested for promoter activity within the context of the 3-kb POU5F1 promoter driving a luciferase reporter. These constructs were transfected into mouse ESCs and tested for luciferase activity 2 days later. Activity is expressed relative to the wild-type promoter (POU5F1-Luc). The CR4-B-deleted construct (Fig. 1) is included for comparison. (F) EMSA using overexpressed Oct4 or Sox2. Whole-cell lysates from 293T cellstransfected with Pou5f1 or Sox2 expression constructs were used in EMSAs. Oct4 and Sox2 are capable of forming specific complexes as confirmed by supershift analysis. (G) Analysis of the cooperativity of Sox2 and Oct4 binding to the composite sox-oct element. An increasing concentration of Sox2 was added to the probe in the absence or presence of a fixed amount of Oct4 (left panel). Quantitative representation of the DNA binding data is presented in the right panel (a, Oct4/DNA complex in the presence of Sox2, lanes 5 to 7; b, Sox2/DNA complex in the presence of Oct4, lanes 5 to 7; c, Oct4/Sox2/DNA complex, lanes 5 to 7; d, Sox2-DNA complex in the absence of Oct4, lanes 2 to 4; e, predicted amount of Oct4/Sox2/DNA complex if Oct4 and Sox2 bind independently of each other and show no cooperativity). The x axis represents the different amounts (microliters) of Sox2 added to the EMSA reaction mixtures. The amount of probe present was determined by PhosphorImager analysis and expressed as the percentage of total probe for each sample (y axis, percent probe bound). (H) Analysis of the cooperativity of Oct4 and Sox2 binding to the composite sox-oct element. Oct4 was titrated with a fixed amount of Sox2. Quantitative representation of the DNA binding data is presented in the right panel (a, Oct4/DNA complex in the presence of Sox2, lanes 5 to 7; b, Sox2/DNA complex in the presence of Oct4, lanes 5 to 7; c, Oct4/Sox2/DNA complex, lanes 5 to 7; d, Oct4-DNA complex in the absence of Sox2, lanes 2 to 4; e, predicted amount of Oct4/Sox2/DNA complex).
FIG. 5.
FIG. 5.
Regulation of POU5F1 promoter activity by Oct4 and Sox2. (A) Schematic of the luciferase reporter constructs used to measure the effects of RNAi. Construct I contains the Pou5f1 ORF fused downstream of the luciferase reporter, while construct II contains the Sox2 ORF fused downstream of the luciferase reporter. Construct III comprises the POU5F1 promoter containing the sox-oct composite element driving a luciferase reporter. (B and C) Specificity of Pou5f1 (B) and Sox2 (C) RNAi was tested by cotransfection of these constructs with their respective Luc-ORF reporter constructs into 293T cells. (D) Effect of Pou5f1 or Sox2 RNAi on POU5F1 promoter activity was tested by cotransfecting each RNAi plasmid along with the POU5F1-Luc construct into mouse ESCs. In all, luciferase activity was analyzed 2 days after transfection and was expressed relative to the empty RNAi vector control. A Gfp RNAi was used as a nonspecific control. Standard deviations are shown.
FIG. 6.
FIG. 6.
Regulation of endogenous Pou5f1 expression by Sox2 in ESCs. (A) Schematic of the RNAi vector and a flow chart of the corresponding experiments. The vector contains a puromycin selection cassette. Location of the RNAi sequence is indicated by arrowheads. (B to D) Effects of Pou5f1 (B) and Sox2 (C and D) RNAi on endogenous levels of Pou5f1 (B and D) and Sox2 (C) mRNA in ESCs. Endogenous mRNA levels are expressed relative to the empty RNAi vector control. A nonspecific control Gfp RNAi was included. (E) Knockdown of the protein was confirmed by Western blotting. Actin served as a loading control. (F) Morphological changes of Pou5f1 or Sox2 knockdown cells. Note the presence of flattened epithelial-cell-like cells in knockdown cells not seen at all in vector control ESCs. (G) Alkaline phosphatase staining of Pou5f1 or Sox2 knockdown cells. Note that, in the knockdown cells, almost all the cells stain negatively for alkaline phosphatase. (H) Changes in gene expression following Pou5f1 or Sox2 knockdown by RNAi. cDNAs were prepared from the knockdown cells and analyzed by real-time PCR with fold differences measured against vector control ESCs.
FIG. 6.
FIG. 6.
Regulation of endogenous Pou5f1 expression by Sox2 in ESCs. (A) Schematic of the RNAi vector and a flow chart of the corresponding experiments. The vector contains a puromycin selection cassette. Location of the RNAi sequence is indicated by arrowheads. (B to D) Effects of Pou5f1 (B) and Sox2 (C and D) RNAi on endogenous levels of Pou5f1 (B and D) and Sox2 (C) mRNA in ESCs. Endogenous mRNA levels are expressed relative to the empty RNAi vector control. A nonspecific control Gfp RNAi was included. (E) Knockdown of the protein was confirmed by Western blotting. Actin served as a loading control. (F) Morphological changes of Pou5f1 or Sox2 knockdown cells. Note the presence of flattened epithelial-cell-like cells in knockdown cells not seen at all in vector control ESCs. (G) Alkaline phosphatase staining of Pou5f1 or Sox2 knockdown cells. Note that, in the knockdown cells, almost all the cells stain negatively for alkaline phosphatase. (H) Changes in gene expression following Pou5f1 or Sox2 knockdown by RNAi. cDNAs were prepared from the knockdown cells and analyzed by real-time PCR with fold differences measured against vector control ESCs.
FIG. 7.
FIG. 7.
Oct4 and Sox2 bind to the 3′ enhancer of Sox2 and regulate its activity. (A) The reporter construct used to assay for Sox2 enhancer activity consisted of the Sox2 SRR2 site positioned 5′ to the SV40 promoter driving a luciferase reporter. (B) The SRR2 enhancer drives luciferase expression specific to ESC. (C) The Sox2 luciferase reporter construct was cotransfected into mouse ESCs with either empty vector or RNAi constructs directed against Sox2, Pou5f1, or Gfp RNAi vector. The knockdown effect is measured by relative luciferase activity 60 h after transfection, with the empty vector set at 100%. The standard deviations are shown. (D) Endogenous Sox2 mRNA levels in ESCs were measured by real-time PCR after transfection with the respective RNAi constructs containing a puromycin resistance gene. Cells were harvested 2 days posttransfection after continuous puromycin selection. Endogenous Sox2 levels are expressed relative to the empty vector control. Standard deviations are shown. (E) Schematic of mouse Sox2 genomic locus with the single exon represented by an open box and the SRR2 region containing the composite sox-oct element indicated. The relative locations of the amplicons used to detect enriched ChIP fragments are shown (A to C). (F) Measurement by ChIP analysis of Oct4 occupancy in regions of Sox2 in undifferentiated mouse ESCs and those induced to differentiate for 3 and 6 days by RA. Letters correspond to the amplicons indicated in panel E. Standard deviations are shown. (G) Similar to panel F but for Sox2 occupancy. (H) Schematic of human SOX2 genomic locus with the single exon represented by an open box and the SRR2 region containing the composite sox-oct element indicated. The relative locations of the amplicons used to detect enriched ChIP fragments are shown (A and B). (I) Measurement by ChIP analysis of OCT4 and SOX2 occupancies on SOX2 in living human ESCs. A glutathione S-transferase antibody (GST) was used as a negative control. Standard deviations are shown.
FIG. 7.
FIG. 7.
Oct4 and Sox2 bind to the 3′ enhancer of Sox2 and regulate its activity. (A) The reporter construct used to assay for Sox2 enhancer activity consisted of the Sox2 SRR2 site positioned 5′ to the SV40 promoter driving a luciferase reporter. (B) The SRR2 enhancer drives luciferase expression specific to ESC. (C) The Sox2 luciferase reporter construct was cotransfected into mouse ESCs with either empty vector or RNAi constructs directed against Sox2, Pou5f1, or Gfp RNAi vector. The knockdown effect is measured by relative luciferase activity 60 h after transfection, with the empty vector set at 100%. The standard deviations are shown. (D) Endogenous Sox2 mRNA levels in ESCs were measured by real-time PCR after transfection with the respective RNAi constructs containing a puromycin resistance gene. Cells were harvested 2 days posttransfection after continuous puromycin selection. Endogenous Sox2 levels are expressed relative to the empty vector control. Standard deviations are shown. (E) Schematic of mouse Sox2 genomic locus with the single exon represented by an open box and the SRR2 region containing the composite sox-oct element indicated. The relative locations of the amplicons used to detect enriched ChIP fragments are shown (A to C). (F) Measurement by ChIP analysis of Oct4 occupancy in regions of Sox2 in undifferentiated mouse ESCs and those induced to differentiate for 3 and 6 days by RA. Letters correspond to the amplicons indicated in panel E. Standard deviations are shown. (G) Similar to panel F but for Sox2 occupancy. (H) Schematic of human SOX2 genomic locus with the single exon represented by an open box and the SRR2 region containing the composite sox-oct element indicated. The relative locations of the amplicons used to detect enriched ChIP fragments are shown (A and B). (I) Measurement by ChIP analysis of OCT4 and SOX2 occupancies on SOX2 in living human ESCs. A glutathione S-transferase antibody (GST) was used as a negative control. Standard deviations are shown.
FIG. 8.
FIG. 8.
Oct4-Sox2 regulatory circuitry in ESCs. Transcription factors are represented by ovals, and regulatory elements of the genes are represented by rectangles (gene names are printed in italics). (A) The relationships between Oct4 and Sox2 and their respective genes. The links are based on evidence derived from ChIP and RNAi experiments. A solid arrow indicates a transcription factor positively regulating a gene via direct binding of a cis element. Dashed arrows denote the synthesis of transcription factors by their respective genes. (B) An autoregulation motif for Pou5f1. Although not shown, Sox2 has a similar configuration. (C) A multicomponent loop showing the link between Pou5f1 and Sox2.

References

    1. Ambrosetti, D. C., C. Basilico, and L. Dailey. 1997. Synergistic activation of the fibroblast growth factor 4 enhancer by Sox2 and Oct-3 depends on protein-protein interactions facilitated by a specific spatial arrangement of factor binding sites. Mol. Cell. Biol. 17:6321-6329. - PMC - PubMed
    1. Ambrosetti, D. C., H. R. Scholer, L. Dailey, and C. Basilico. 2000. Modulation of the activity of multiple transcriptional activation domains by the DNA binding domains mediates the synergistic action of Sox2 and Oct-3 on the fibroblast growth factor-4 enhancer. J. Biol. Chem. 275:23387-23397. - PubMed
    1. Avilion, A. A., S. K. Nicolis, L. H. Pevny, L. Perez, N. Vivian, and R. Lovell-Badge. 2003. Multipotent cell lineages in early mouse development depend on SOX2 function. Genes Dev. 17:126-140. - PMC - PubMed
    1. Ben-Shushan, E., H. Sharir, E. Pikarsky, and Y. Bergman. 1995. A dynamic balance between ARP-1/COUP-TFII, EAR-3/COUP-TFI, and retinoic acid receptor:retinoid X receptor heterodimers regulates Oct-3/4 expression in embryonal carcinoma cells. Mol. Cell. Biol. 15:1034-1048. - PMC - PubMed
    1. Ben-Shushan, E., J. R. Thompson, L. J. Gudas, and Y. Bergman. 1998. Rex-1, a gene encoding a transcription factor expressed in the early embryo, is regulated via Oct-3/4 and Oct-6 binding to an octamer site and a novel protein, Rox-1, binding to an adjacent site. Mol. Cell. Biol. 18:1866-1878. - PMC - PubMed

Publication types

MeSH terms