. 2005 Jul;25(14):6065-76.
doi: 10.1128/MCB.25.14.6065-6076.2005.

Dysregulation of the peroxisome proliferator-activated receptor target genes by XPD mutations

Affiliations

Dysregulation of the peroxisome proliferator-activated receptor target genes by XPD mutations

Emmanuel Compe et al. Mol Cell Biol. 2005 Jul.

Abstract

Mutations in the XPD subunit of TFIIH give rise to human genetic disorders initially defined as DNA repair syndromes. Nevertheless, xeroderma pigmentosum (XP) group D (XP-D) patients develop clinical features such as hypoplasia of the adipose tissue, implying a putative transcriptional defect. Knowing that peroxisome proliferator-activated receptors (PPARs) are implicated in lipid metabolism, we investigated the expression of PPAR target genes in the adipose tissues and the livers of XPD-deficient mice and found that (i) some genes are abnormally overexpressed in a ligand-independent manner which parallels an increase in the recruitment of RNA polymerase (pol) II but not PPARs on their promoter and (ii) upon treatment with PPAR ligands, other genes are much less induced compared to the wild type, which is due to a lower recruitment of both PPARs and RNA pol II. The defect in transactivation by PPARs is likely attributable to their weaker phosphorylation by the cdk7 kinase of TFIIH. Having identified the phosphorylated residues in PPAR isotypes, we demonstrate how their transactivation defect in XPD-deficient cells can be circumvented by overexpression of either a wild-type XPD or a constitutively phosphorylated PPAR S/E. This work emphasizes that underphosphorylation of PPARs affects their transactivation and consequently the expression of PPAR target genes, thus contributing in part to the XP-D phenotype.


Figures

FIG. 1.
FIG. 1.
Lean phenotype in TTD mice. (A) Photographs of representative 3-month-old XPD+/+, XPDR722W/R722W, and XPD+/R722W mice. (B) Body weights of male WT (n = 6) and TTD (n = 6) mice were monitored for 18 months. (C) Weights of the liver (Liv), intraperitoneal WAT, and interscapular BAT were normalized to body weight for 3- and 6-month-old male TTD mice (n = 6). The values are percentages relative to those observed for WT mice.
FIG. 2.
FIG. 2.
Expression of PPARγ target genes in TTD adipose tissues. (A) Ventral view of 3-, 6-, and 18-month-old WT (parts 1, 3, and 5) and TTD (parts 2, 4, and 6) mice. Note the progressive loss of visceral fat pads in TTD mice (arrows). (B) H&E-stained sections of intraperitoneal WAT and interscapular BAT of 3-month-old WT and TTD mice. BAT was also stained with lipid-specific oil red-O dye. Magnification is indicated at the bottom left of each part. (C) Gene expression in WAT and BAT of 3-month-old WT (dark boxes, n = 4) and TTD (open boxes, n = 4) mice on standard chow (−) or supplemented with rosiglitazone, a specific PPARγ ligand (+ Rosi; 10 mg/kg body weight for 3 days). The values were normalized relative to 18S RNA expression. The full names of the genes are given in the text. The recruitment of PPARγ and RNA pol II on the corresponding promoters was also analyzed by ChIP assays in WT (dark boxes) and TTD (open boxes) adipose tissues. Immunoprecipitated DNA was quantified by real-time quantitative PCR. Results are expressed as n-fold recruitment relative to nontreated WT mice.
FIG. 3.
FIG. 3.
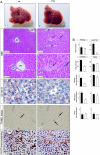
Expression of PPARα target genes in the TTD liver. (A) Macroscopic view (parts 1 and 2) of 3-month-old WT and TTD mouse livers. Parts 3 to 6: H&E-stained liver sections. Arrows indicate focal lesions corresponding to hepatic necrosis. Parts 7 and 8: oil red-O-dyed liver sections. Parts 9 and 10: in situ apoptosis detection in liver sections by TUNEL assay (see arrows). Parts 11 and 12: immunoperoxidase staining of liver sections for detection of the Ki67 antigen. Arrows indicate Ki67-positive nuclei. PV and CV, portal and centrolobular veins. Magnificationsare indicated. (B) Expression of PPARα target genes in the livers of 3-month-old WT (black boxes, n = 4) and TTD (open boxes, n = 4) mice treated for 20 h with WY14643 (100 mg/kg body weight). The results are presented as n-fold induction relative to nontreated mice. ChIP analyses were also performed on the CD36 and CYP4A1 promoters in the liver of WT (dark boxes) and TTD (open boxes) mice. Soluble chromatin was immunoprecipitated with antibodies raised against PPARα, RNA pol II, or TFIIH (XPB). Immunoprecipitated DNA was quantified by real-time quantitative PCR. Results are expressed as n-fold recruitment relative to nontreated mice.
FIG. 4.
FIG. 4.
Interaction between TFIIH and PPARs and determination of their cdk7 phosphorylation sites. (A) Sf9 cells were coinfected with baculoviruses encoding the subunits of TFIIH (rIIH wt) and PPARγ2 (left part), VDR (middle part), or PPARα (right part). Immunoprecipitation (IP) was done using an antibody directed against the TFIIH/p44 subunit (Ab-p44, lanes 5 to 8) or a control antibody (Ab-C, lanes 9). The bound proteins were analyzed by Western blotting using antibodies against subunits of TFIIH (XPD, p62 and cdk7), PPARγ2, VDR, or PPARα. (B) Sf9 cell extracts overexpressing each TFIIH subunit alone (−) or in combination with PPARγ2 or PPARα (as indicated) were incubated with antibodies directed against the corresponding PPAR isotype. Immunoprecipitated proteins were analyzed by Western blotting using antibodies against each subunit of TFIIH. The input lanes (IN) represent 10% of the total volume of extracts used in each immunoprecipitation. (C) Schematic representation of the truncated PPAR proteins with a histidine tag (dark box). The different domains (A to F) of PPARγ2 and PPARα and the cdk7 phosphorylation sites are depicted. Serine 112 in PPARγ2 corresponds to serine 84 in the PPARγ1 isoform. (D) Purified PPAR, PPARΔA/B, and A/B PPAR were incubated in the absence (lanes 1, 4, 7, and 10) or presence of either free CAK (lanes 2, 5, and 8), TFIIH isolated from HeLa cells (lanes 3, 6, and 9), recombinant TFIIH (rIIH wt, lanes 11), or recombinant TFIIH mutated in the cdk7 ATP binding site (rIIH CKmut, lanes 12). Coomassie blue-stained gels (top parts) and autoradiography (Autoradio; bottom parts) of the incubated fractions are shown. (E) Left part: A/B PPARγ1-wt, A/B PPARγ2-wt, A/B PPARγ1 S84A, and A/B PPARγ2 S112A were incubated with CAK or TFIIH in the presence of 0.14 μM [γ-32P]ATP. Right part: purified A/B PPARα-wt, S12A, S21A, and S12A/S21A were incubated with CAK and increasing concentrations of [γ-32P]ATP (0.07, 0.14, 0.42, and 0.70 μM).
FIG. 5.
FIG. 5.
Phosphorylation of PPARs is crucial for their transactivation. (A) Left part: Western blotting analysis of PPARγ1 and -2 (Ab PPARγ) and their phosphorylated status on serines 84 and 112 (Ab PPARγ-P) in WAT (10 μg, lanes 1 and 2) and BAT (25 μg, lanes 3 and 4) nuclear extracts from 3-month-old WT and TTD mice. TBP (Ab TBP) was used as an internal control. Middle part: detection of PPARγ2 (PPARγ), its phosphorylated status on serine 112 (Ab PPAR-P) and XPD (Ab XPD) in crude extracts (100 μg) from HeLa and HD2 (bearing XPD point mutation R683W) cells overexpressing PPARγ2 (lanes 1 to 4) and WT XPD (+ XPD, lanes 3 and 4). TBP (Ab TBP) was used as an internal control. Right part: detection of PPARα (Ab PPARα), phosphorylated S12 PPARα (Ab PPARα/S12), and TBP (Ab TBP) in hepatic nuclear extracts (25 μg) from 3-month-old WT and TTD mice. (B) WT (dark boxes) and TTD (open boxes) mouse fibroblasts were cotransfected with pPPAR-RE-Luc (1 μg), pCH110 (1 μg), and either PPARγ1-wt, PPARγ2-wt, PPARγ1S84A, PPARγ1S84E, PPARγ2S112A, PPARγ2S112E, pSG5-PPARα-wt, PPARα S12A/S21A, or PPARαS12E/S21E(100 ng). The cells were next treated with a specific ligand for PPARγ1/2 (rosiglitazone, 0.5 μM) or PPARα (WY14643, 1 μM). Luciferase (Luc) activity was measured 24 h later and normalized relative to β-galactosidase activity. Note that the β-galactosidase values were similar in WT and TTD fibroblasts. (C) HeLa (dark boxes) and HD2 (open boxes) cells were transfected with pPPAR-RE-Luc (1 μg), pCH110 (1 μg), pSG5-PPARγ1 (100 ng), pSG5-PPARγ2 (100 ng), pSG5-PPARα (100 ng), and either pcDNA-XPDwt (XPDwt) or empty pcDNA. Cells were then treated with the corresponding ligand, as mentioned for panel B. The values are presented as percentages, 100% being the level of transactivation obtained in HeLa cells overexpressing each PPAR isotype in the presence of the corresponding ligand. Rosi, rosiglitazone.

References

    1. Adams, M., M. J. Reginato, D. Shao, M. A. Lazar, and V. K. Chatterjee. 1997. Transcriptional activation by peroxisome proliferator-activated receptor gamma is inhibited by phosphorylation at a consensus mitogen-activated protein kinase site. J. Biol. Chem. 272:5128-5132. - PubMed
    1. Akoulitchev, S., S. Chuikov, and D. Reinberg. 2000. TFIIH is negatively regulated by cdk8-containing mediator complexes. Nature 407:102-106. - PubMed
    1. Auwerx, J. 1999. PPARγ, the ultimate thrifty gene. Diabetologia 42:1033-1049. - PubMed
    1. Berger, J., and D. E. Moller. 2002. The mechanisms of action of PPARs. Annu. Rev. Med. 53:409-435. - PubMed
    1. Bootsma, D., and J. H. J. Hoeijmakers. 1993. DNA repair. Engagement with transcription. Nature 363:114-115. - PubMed

Publication types

MeSH terms