. 2005 Jul;25(14):6225-34.
doi: 10.1128/MCB.25.14.6225-6234.2005.

Myc stimulates nuclearly encoded mitochondrial genes and mitochondrial biogenesis

Affiliations

Myc stimulates nuclearly encoded mitochondrial genes and mitochondrial biogenesis

Feng Li et al. Mol Cell Biol. 2005 Jul.

Abstract

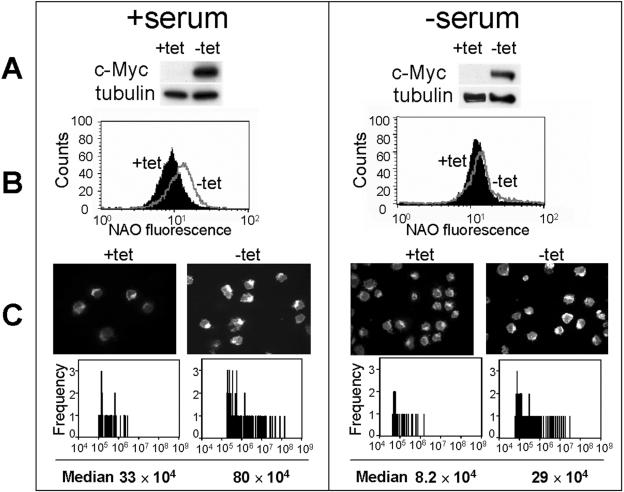
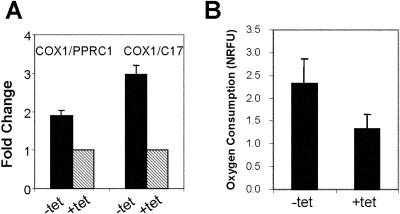
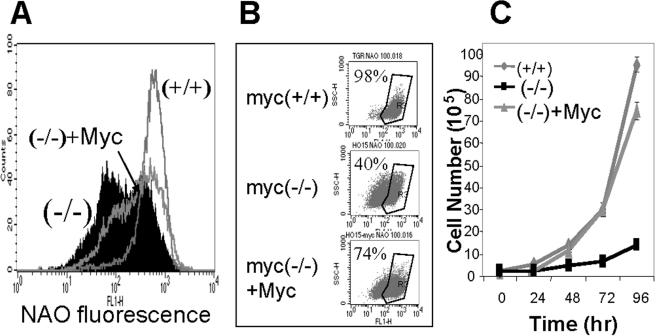
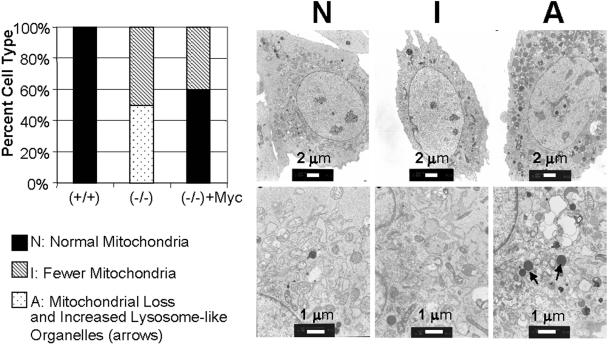
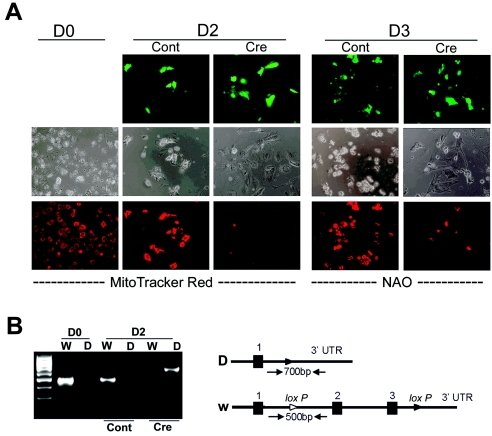
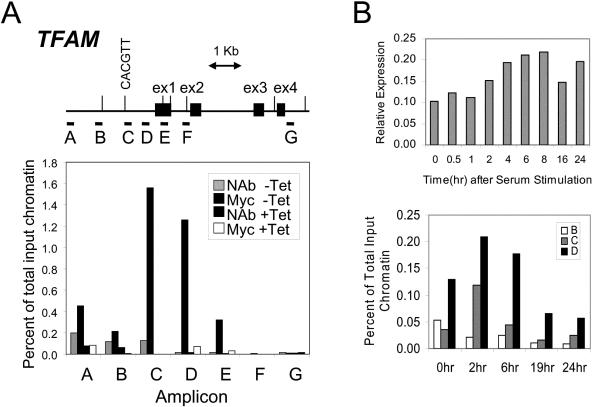
Although several genes involved in mitochondrial function are direct Myc targets, the role of Myc in mitochondrial biogenesis has not been directly established. We determined the effects of ectopic Myc expression or the loss of Myc on mitochondrial biogenesis. Induction of Myc in P493-6 cells resulted in increased oxygen consumption and mitochondrial mass and function. Conversely, compared to wild-type Myc fibroblasts, Myc null rat fibroblasts have diminished mitochondrial mass and decreased number of normal mitochondria. Reconstitution of Myc expression in Myc null fibroblasts partially restored mitochondrial mass and function and normal-appearing mitochondria. Concordantly, we also observed in primary hepatocytes that acute deletion of floxed murine Myc by Cre recombinase resulted in diminished mitochondrial mass in primary hepatocytes. Our microarray analysis of genes responsive to Myc in human P493-6 B lymphocytes supports a role for Myc in mitochondrial biogenesis, since genes involved in mitochondrial structure and function are overrepresented among the Myc-induced genes. In addition to the known direct binding of Myc to many genes involved in mitochondrial structure and function, we found that Myc binds the TFAM gene, which encodes a key transcriptional regulator and mitochondrial DNA replication factor, both in P493-6 lymphocytes with high ectopic MYC expression and in serum-stimulated primary human 2091 fibroblasts with induced endogenous MYC. These observations support a pivotal role for Myc in regulating mitochondrial biogenesis.


Figures

FIG. 1.
FIG. 1.
c-Myc increases mitochondrial mass and activity under high (10%; left panels)- or low (0.25%; right panels)-serum conditions. P493-6 cells were plated in presence (+tet, low Myc) or absence (-tet, high Myc) of tetracycline for 72 h in either high or low serum. The cells were collected as described in Materials and Methods. (A) c-Myc levels were determined by immunoblotting. Tubulin served as a loading control. (B) Fluorescence intensity of NAO staining (x axis) in cells as determined by flow cytometry. The y axis represents cell numbers. (C) Representative confocal micrographs of MitoTracker Red-stained cells are shown in the upper panels. The lower panels show the signal intensity distribution of MitoTracker Red staining as a measure of mitochondrial activity and content, using signal segmentation of the IP lab software. The median of relative signal intensity is also indicated. Exposure times for the confocal micrographs were kept constant between high-Myc and low-Myc conditions but were slightly different for high- versus low-serum conditions.
FIG. 2.
FIG. 2.
c-Myc induction increases mitochondrial DNA copies and cellular oxygen consumption. P493-6 cells were treated as described in the legend to Fig. 1 under high-serum conditions, and then cells were collected as described in Materials and Methods. (A) Quantitative real-time PCR was performed on the mitochondrial gene COX1, and the nuclear genes PPRC1 and C17 were used as internal controls. The fold changes were calculated relative to the DNA level in tetracycline-treated (+tet, low Myc) cells. Shown are averages from three independent experiments ± standard errors of the means. (B) Total cellular oxygen consumption, shown as averages from two independent experiments ± standard deviations. NRFU, normalized relative fluorescent units.
FIG. 3.
FIG. 3.
Mitochondrial mass is decreased in Myc null fibroblasts. (A and B) Log-phase-growing myc+/+, myc−/−, and myc−/− + Myc cells were stained with NAO. (A) The flow cytometric histogram shows the fluorescence intensity corresponding to mitochondrial mass. Myc+/+ cells have one signal peak at high fluorescence intensity, while myc−/− and myc−/− + Myc cells have two peaks. (B) The three small dot plots show the percentage of cells gated for higher fluorescence intensity. (C) Growth rates of myc+/+, myc−/−, and myc−/− + Myc fibroblasts.
FIG. 4.
FIG. 4.
Ultrastructural analysis of mitochondria in rat fibroblasts. Left, quantitation of the types of cells found in fibroblasts. A total of 10 individual cells each from log-phase-growing myc+/+, myc−/−, and myc−/− + Myc cells were classified and are shown as the percentage displaying N, I, or A morphology. Right, electron micrographs of three major morphological categories: N, abundant, normal mitochondrial sections; I, fewer, normal mitochondrial sections; A, dramatic loss of mitochondrial sections with increased lysosome-like organelles. The lower panels are higher magnifications of the upper panels.
FIG. 5.
FIG. 5.
Acute deletion of floxed Myc in isolated murine hepatocytes is associated with decreased stainable mitochondria. (A) Fluorescence and phase-contrast micrographs of cultured primary hepatocytes from homozygous mice with floxed Myc before (day 0) and 2 or 3 days after control (Cont) or Cre recombinase adenoviral infection. GFP fluorescence micrographs of adenovirally infected hepatocytes (top panels) at days 2 and 3 are shown. The same cells were stained with either MitoTracker Red (shown for day 2) or nonyl acridine orange (shown for day 3). Fluorescence micrographs of controls or Cre recombinase-treated cells were obtained with identical exposure times for each different fluorochrome (GFP, NAO, or MitoTracker Red). (B) Ethidium-stained agarose gel showing PCR-amplified (35 cycles) genomic DNA from untreated hepatocytes at day 0 or from control or Cre recombinase-treated hepatocytes at day 2. PCR primers used were specific for the undeleted (W) or deleted (D) floxed Myc alleles. W amplicon size, 500 bp; D amplicon size, 700 bp. Molecular markers are shown in the far left lane. UTR, untranslated region.
FIG. 6.
FIG. 6.
c-Myc binds to TFAM in situ. (A) Human genomic sequence starting from 3 kb upstream of exon 1 to 7 kb downstream. Exons are represented by black boxes. The E boxes are indicated with vertical bars, and the E box in amplicon C is illustrated. Horizontal bars labeled A to G indicate the regions amplified for scanning ChIP analysis. P493-6 cells were plated in absence (−Tet) or presence (+Tet) of tetracycline as described in Materials and Methods, and then ChIP was performed with anti-c-Myc antibody (Myc −Tet or Myc +Tet). No-antibody control experiments (NAb −Tet or NAb +Tet) were performed at same time. −Tet corresponds to a high-Myc state, whereas +Tet represents a low-Myc state. Quantitative PCRs were performed. Shown are averages of triplicates. (B) Top, time-dependent expression of TFAM following serum stimulation of human 2091 primary fibroblasts. TFAM expression is shown as normalized expression relative to 18S rRNA. Mean values (with standard deviations of less than 5% of the mean) from triplicate real-time PCRs are shown. Bottom, chromatin immunoprecipitation assays showing time-dependent binding of Myc to TFAM following serum stimulation of human 2091 primary fibroblasts. Binding to amplicons B, C, and D, which are defined in panel A, is shown as a percentage of total input DNA.

References

    1. Amati, B., K. Alevizopoulos, and J. Vlach. 1998. Myc and the cell cycle. Front Biosci. 3:d250-d268. - PubMed
    1. Arabi, A., S. Wu, K. Ridderstrale, H. Bierhoff, C. Shiue, K. Fatyol, S. Fahlen, P. Hydbring, O. Soderberg, I. Grummt, L. G. Larsson, and A. P. Wright. 2005. c-Myc associates with ribosomal DNA and activates RNA polymerase I transcription. Nat. Cell. Biol. 7:303-310. - PubMed
    1. Blackwell, T. K., J. Huang, A. Ma, L. Kretzner, F. W. Alt, R. N. Eisenman, and H. Weintraub. 1993. Binding of myc proteins to canonical and noncanonical DNA sequences. Mol. Cell. Biol. 13:5216-5224. - PMC - PubMed
    1. Boyd, K. E., J. Wells, J. Gutman, S. M. Bartley, and P. J. Farnham. 1998. c-Myc target gene specificity is determined by a post-DNA binding mechanism. Proc. Natl. Acad. Sci. USA 95:13887-13892. - PMC - PubMed
    1. Cam, H., E. Balciunaite, A. Blais, A. Spektor, R. C. Scarpulla, R. Young, Y. Kluger, and B. D. Dynlacht. 2004. A common set of gene regulatory networks links metabolism and growth inhibition. Mol. Cell 16:399-411. - PubMed

Publication types

MeSH terms