. 2005;3(2):93-113.
doi: 10.1385/NI:3:2:093.

Statistical criteria in FMRI studies of multisensory integration

Affiliations

Statistical criteria in FMRI studies of multisensory integration

Michael S Beauchamp. Neuroinformatics. 2005.

Abstract

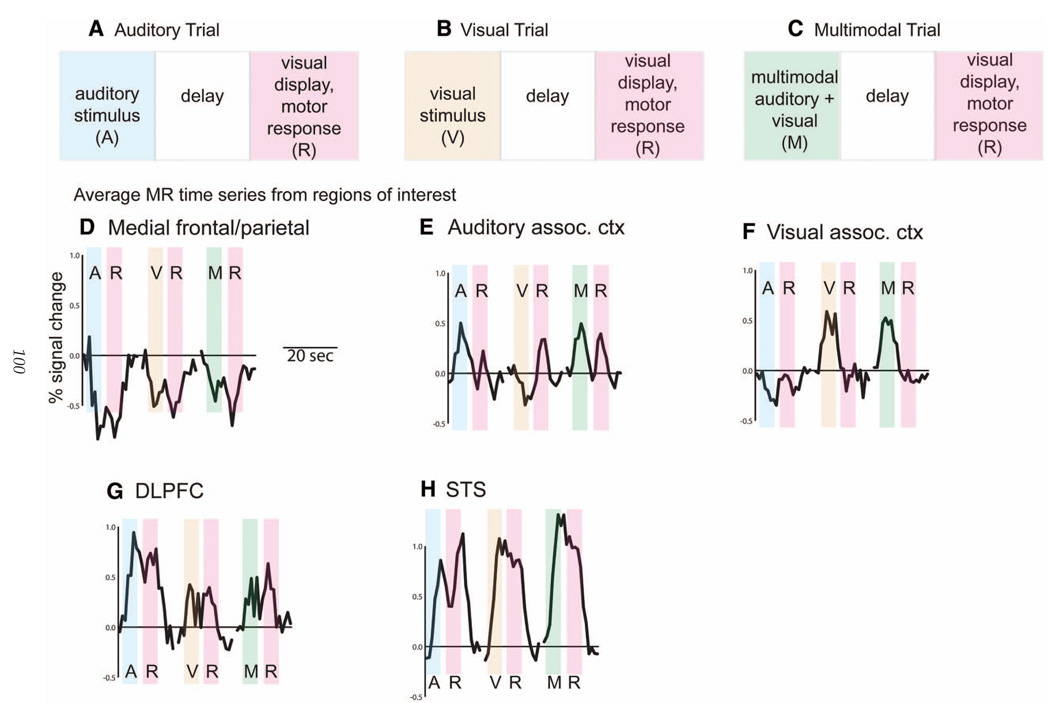
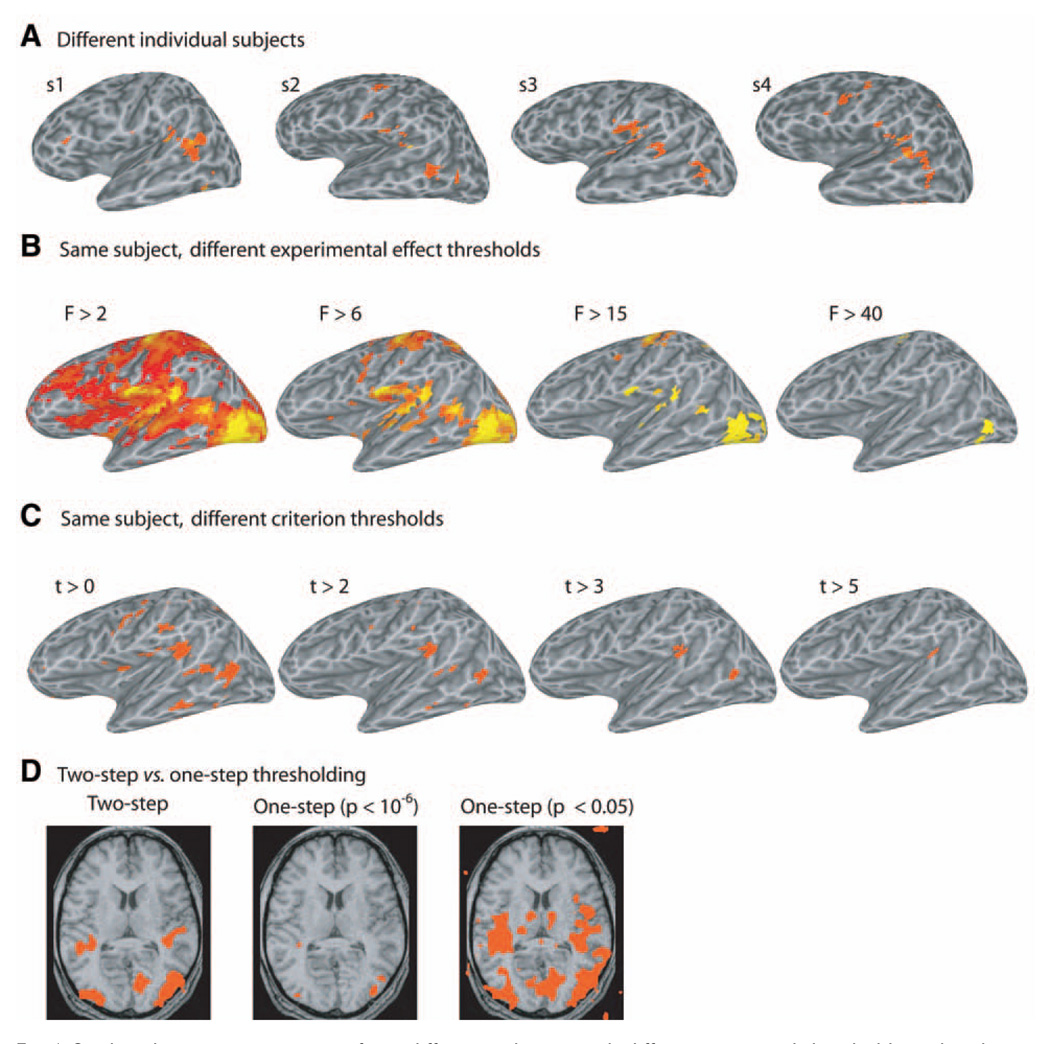
Inferences drawn from functional magnetic resonance imaging (fMRI) studies are dependent on the statistical criteria used to define different brain regions as "active" or "inactive" under the experimental manipulation. In fMRI studies of multisensory integration, additional criteria are used to classify a subset of the active brain regions as "multisensory." Because there is no general agreement in the literature on the optimal criteria for performing this classification, we investigated the effects of seven different multisensory statistical criteria on a single test dataset collected as human subjects performed auditory, visual, and auditory- visual object recognition. Activation maps created using the different criteria differed dramatically. The classification of the superior temporal sulcus (STS) was used as a performance measure, because a large body of converging evidence demonstrates that the STS is important for auditory-visual integration. A commonly proposed criterion, "supra-additivity" or "super-additivity", which requires the multisensory response to be larger than the summed unisensory responses, did not classify STS as multisensory. Alternative criteria, such as requiring the multisensory response to be larger than the maximum or the mean of the unisensory responses, successfully classified STS as multisensory. This practical demonstration strengthens theoretical arguments that the super-additivity is not an appropriate criterion for all studies of multisensory integration. Moreover, the importance of examining evoked fMRI responses, whole brain activation maps, maps from multiple individual subjects, and mixed-effect group maps are discussed in the context of selecting statistical criteria.


Figures

Fig. 1
Fig. 1
Activation maps from a single subject using different multisensory statistical criteria. Lateral and medial views of the inflated left and right hemisphere are shown. Colors indicate functional data (all colored region pass statistical criteria) mapped to the cortical surface. Grayscale indicates anatomical structure with dark gray corresponding to sulcal depths, light gray to gyral crowns. (A) All regions showing a significant experimental effect. Color bar illustrates significance of experimental effect for (A) and (B). (B) All regions showing a significant experimental effect and a positive change from fixation baseline during any experimental condition. Blue circles indicate regions removed by this criterion (evoked MR response from these regions shown in Fig. 2D). (C) Regions from (B) with the additional criterion that the multisensory auditory–visual response (M) must be greater than the sum of the auditory (A) and visual (V) responses. Circles illustrate activity in auditory and visual association cortex (evoked MR responses from these regions shown in Fig. 2E,F). Color bar shows significance of M vs A + V contrast. (D) Regions from (B) with the criterion that the multisensory response is less than the summed auditory and visual responses. Circle illustrates activity in dorsolateral prefrontal cortex (evoked MR response shown in Fig. 2G). Colors show significance of A + V vs M contrast. (E) Regions from (B) with the criterion that the multisensory response is larger than the mean of the auditory and visual response. Circle illustrates activity in superior temporal sulcus (STS) (evoked MR response shown in Fig. 2H). Colors show significance of M vs mean(A,V) contrast.
Fig. 2
Fig. 2
Details of trial structure and evoked MR responses. (A) Each auditory trial consisted of a 2.5-s auditory stimulus (A, blue bar) followed by a 2.5-s delay followed by a 3-s response period (R, purple bar). (B) Visual trial consisted of a visual stimulus (yellow bar, V) followed by delay and response periods. (C) Multisensory trials consisted of a simultaneous auditory and visual stimulus (green bar, M) followed by delay and response periods. (D) Mean evoked MR response from medial frontal and parietal voxels exhibiting signal decreases below fixation baseline in every condition. Location of voxels are shown with blue circles in Fig. 1B. Responses to each trial type are shown sequentially, although they were presented in pseudorandom order separated by varying intertrial intervals of fixation baseline (not shown). (E) Evoked response from voxels in auditory association cortex exhibiting super-additivity (left circle in Fig. 1C). (F) Evoked response from voxels in visual association cortex exhibiting super-additivity (right circle in Fig. 1C).(G) Evoked response from voxels in dorsolateral prefrontal cortex (DLPFC) exhibiting sub-additivity (Fig. 1D). (H) Evoked responses from STS voxels exceeding the mean criterion M (Fig. 1E).
Fig. 3
Fig. 3
Activation maps from a single subject using different multisensory statistical criteria. Display conventions as in Fig. 1. (A) All regions showing a significant experimental effect (Fig. 1A) and a positive change from fixation baseline during auditory or visual stimulation epochs (A > 0 OR V > 0). Black arrow indicates large focus of activity in STS. Color bar indicates significance of experimental effect. (B) Regions from (A) with the additional criterion of super-additivity. No voxels pass the criterion. (C) Voxels from (A) that also exceed the mean criterion. Color bar show significance of M vs mean(A,V) contrast. (D) Voxels from (A) exceeding the max criterion. Colors show significance of M vs max (A,V) contrast.
Fig. 4
Fig. 4
The mixed-effects group average map from eight subjects created using different multisensory statistical criteria.Volume renderings of lateral and medial views of left and right hemisphere are shown. Colors indicate average functional data, grayscale indicates anatomical structure from a single subject. Activations with |x| > 30 are visualized in the lateral rendering, activations with |x| < 30 are visualized in the medial rendering. (A) All regions showing a significant experimental effect. Color bar illustrates significance of experimental effect for (A) and (B). (B) All regions showing a significant experimental effect and a positive change from fixation baseline during any experimental condition. (C) Regions from (B) with the additional criterion of super-additivity. Color bar shows significance of M vs A +V contrast. (D) Regions from (B) with the additional criterion of sub-additivity. Color bar shows significance of A +V vs M contrast. (E) Regions from (B) that also exceed the mean criterion. Color bar show significance of M vs mean(A,V) contrast.
Fig. 5
Fig. 5
The mixed-effects group average map created using different multisensory statistical criteria. Display conventions as in Fig.4. (A) All regions showing a significant experimental effect (Fig.4A) and a positive change from fixation baseline during auditory or visual stimulation epochs (A > 0 OR V > 0). Color bar indicates significance of experimental effect. (B) Regions from (A) with the additional criterion of super-additivity. No voxels pass the criterion. (C) Voxels from (A) that also exceed the mean criterion. Color bar show significance of M vs mean(A,V) contrast. (D) Voxels from (A) exceeding the max criterion. Colors show significance of M vs max(A,V) contrast.
Fig. 6
Fig. 6
Single subject activation maps from different subjects, with different statistical thresholds, and with one or two statistical criteria. (A) Lateral views of the left hemisphere from four subjects illustrating regions showing a significant experimental effect, a positive change from fixation baseline during auditory or visual stimulation epochs, and meeting the mean criterion M > mean(A,V). Compare with Fig. 3C for a fifth subject. (B) Lateral view of a single subject left hemisphere at four different thresholds for the overall experimental effect, measured as an F-ratio. (C) Lateral view of a single subject left hemisphere at four different thresholds for the t-statistic of the contrast M vs max(A,V). Overall experimental effect threshold set to F > 8. (D) Axial slice (z = 10) through an individual subject using a two-step analysis, a one-step analysis with high threshold, or a one-step analysis with liberal threshold.

References

    1. Alais D, Burr D. The ventriloquist effect results from near-optimal bimodal integration. Curr. Biol. 2004;14:257–262. - PubMed
    1. Amedi A, Jacobson G, Hendler T, Malach R, Zohary E. Convergence of visual and tactile shape processing in the human lateral occipital complex. Cereb. Cortex. 2002;12:1202–1212. - PubMed
    1. Amedi A, Malach R, Hendler T, Peled S, Zohary E. Visuo-haptic object-related activation in the ventral visual pathway. Nat. Neurosci. 2001;4:324–330. - PubMed
    1. Argall BD, Saad ZS, Beauchamp MS. A simplified method for intersubject overaging on the cartical surface using SUMA. Human Brain Mapping. in press. - PMC - PubMed
    1. Beauchamp MS. See me, hear me, touch me: multisensory integration in lateral occipital-temparal cortex. Curr, opin. Neurobiol. 2005;15:145–153. - PubMed

Publication types