. 2005 Aug 15;27(2):368-76.
doi: 10.1016/j.neuroimage.2005.04.009.

A simple nonparametric statistical thresholding for MEG spatial-filter source reconstruction images

Affiliations

A simple nonparametric statistical thresholding for MEG spatial-filter source reconstruction images

Kensuke Sekihara et al. Neuroimage. .

Abstract

This paper proposes a simple statistical method for extracting target source activities from spatio-temporal source activities reconstructed from MEG measurements. The method requires measurements in a control condition, which contains only non-target source activities. The method derives, at each pixel location, an empirical probability distribution of the non-target source activity using the time course reconstruction obtained from the control period. The statistical threshold that can extract the target source activities is derived from the empirical distributions obtained from all pixel locations. Here, the multiple comparison problem is addressed with a two-step procedure involving standardizing these empirical distributions and deriving an empirical distribution of the maximum pseudo T value at each pixel location. The results of applying the proposed method to auditory-evoked measurements are presented to demonstrate the method's effectiveness.


Figures

Fig. 1
Fig. 1
(a) The coordinate system and source-sensor configuration used in the numerical experiments. The coordinate origin was set at the center of the sensor coil located at the center of the array. The three point-like sources, shown by the small filled circles, were assumed to be located at (0, −1, −6) cm, (0, 1, −6) cm, and (0, −1.6, −7.2) cm on the plane of x = 0. The large circle indicates the projection of the sphere used for the forward calculation. (b) The first three panels from top to bottom show the time courses assumed as the time courses of the first, second, and third sources, respectively. The bottom panel shows the simulated magnetic recordings used for the reconstruction experiments.
Fig. 2
Fig. 2
(a) The reconstructed time courses for the first source s^(r1,t) (upper), the second source s^(r2,t) (middle), and the third source s^(r3,t) (bottom). (b) The snapshot reconstruction at 220 ms s^(r,220) (upper left), and 265 ms s^(r,265) (upper right), and 300 ms s^(r,300) (lower left). The time instants at 220, 265, and 300 ms are shown by the three broken vertical lines in Fig. 2(a). (c) The reconstruction averaged over the poststimulus time window, s^(r,t)2post.
Fig. 2
Fig. 2
(a) The reconstructed time courses for the first source s^(r1,t) (upper), the second source s^(r2,t) (middle), and the third source s^(r3,t) (bottom). (b) The snapshot reconstruction at 220 ms s^(r,220) (upper left), and 265 ms s^(r,265) (upper right), and 300 ms s^(r,300) (lower left). The time instants at 220, 265, and 300 ms are shown by the three broken vertical lines in Fig. 2(a). (c) The reconstruction averaged over the poststimulus time window, s^(r,t)2post.
Fig. 3
Fig. 3
(a) Reconstructed magnitude time courses, s^(r1,t), s^(r2,t), and s^(r3,t) are shown from top to bottom, respectively. The horizontal broken lines in the upper two panels show the threshold values at r1 and r2. (b) Histograms of the prestimulus values of s^(r1,t) (upper left), s^(r2,t) (upper right), and s^(r3,t) (lower left)
Fig. 4
Fig. 4
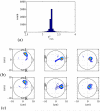
(a) Histogram of Tmaxi. The value of Tmaxth is determined to be 3.40 for a significance level α of 0.05 using this distribution. (b) Thresholded results with α = 0.05 for s^(r,220) (upper left), s^(r,265) (upper right), and s^(r,300) (lower left). (c) The thresholded reconstruction for s^(r,t)2post.
Fig. 4
Fig. 4
(a) Histogram of Tmaxi. The value of Tmaxth is determined to be 3.40 for a significance level α of 0.05 using this distribution. (b) Thresholded results with α = 0.05 for s^(r,220) (upper left), s^(r,265) (upper right), and s^(r,300) (lower left). (c) The thresholded reconstruction for s^(r,t)2post.
Fig. 5
Fig. 5
(a) The 400-epoch-averaged auditory-evoked fields measured using the 275-channel sensor array. Among the 275 sensor recordings, the recordings from 132 sensors covering the subject’s left hemisphere are displayed.
Fig. 6
Fig. 6
The maximum-intensity projections of the source reconstruction obtained using the eigenspace-projected adaptive spatial filter. (a) Snapshot at 44 ms of latency, (b) snapshot at 86 ms of latency, and (c) time averaged reconstruction obtained from the whole prestimulus period (−400 and 0 ms). The left column shows the maximum intensity projections of the three-dimensional reconstruction onto the axial plane. The middle column shows those onto the coronal plane. The left column shows those onto the sagittal plane. The upper case letters L and R show the left and the right hemispheres, respectively.
Fig. 7
Fig. 7
(a) Histogram of Tmaxi from all pixel locations. (b) The results of the proposed statistical thresholding applied to the snapshot shown in Fig. 6(a). (c) The results of the proposed statistical thresholding applied to the snapshot shown in Fig. 6(b).

References

    1. Ḧam̈al̈ainen M, Hari R, IImoniemi RJ, Knuutila J, Lounasmaa OV. Magnetoencephalography-theory, instrumentation, and applications to noninvasive studies of the working human brain. Rev. Mod. Phys. 1993;65:413–497.
    1. Friston KJ, Holmes AP, Worsley KJ, Polin J-P, Frith CD, Frackowiak RSJ. Statistical parametric maps in functional imaging: A general linear approach. Human Brain Mapping. 1995;2:189–210.
    1. Worsley KJ, Marrett S, Neelin P, Vandal AC, Friston KJ, Evans AC. A unified statistical approach for determining significant signals in images of cerebral activation. Human Brain Mapping. 1996;4:58–73. - PubMed
    1. Nichols TE, Holmes AP. Nonparametric permutation tests for functional neuroimaging: a primer with examples. Human Brain Mapping. 2001;15:1–25. - PMC - PubMed
    1. Sekihara K, Nagarajan SS. Neuromagnetic source reconstruction and inverse modeling. In: He B, editor. Modeling and Imaging of Bioelectric Activity - Principles and Applications. Kluwer Academic/Plenum Publishers; 2004. pp. 213–250.

Publication types

MeSH terms