. 2005 Jul 20;24(14):2499-511.
doi: 10.1038/sj.emboj.7600736. Epub 2005 Jun 30.

Metabolon disruption: a mechanism that regulates bicarbonate transport

Affiliations

Metabolon disruption: a mechanism that regulates bicarbonate transport

Bernardo V Alvarez et al. EMBO J. .

Abstract

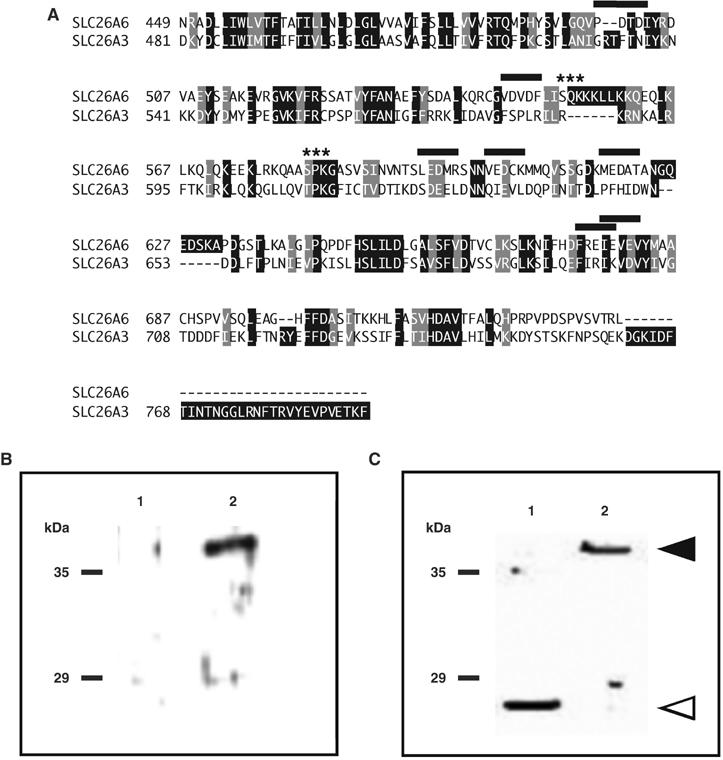
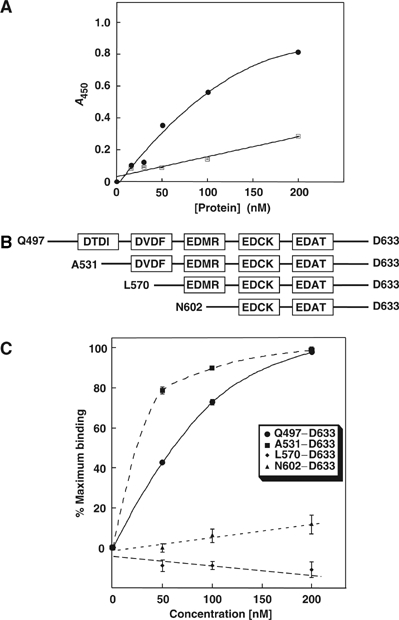
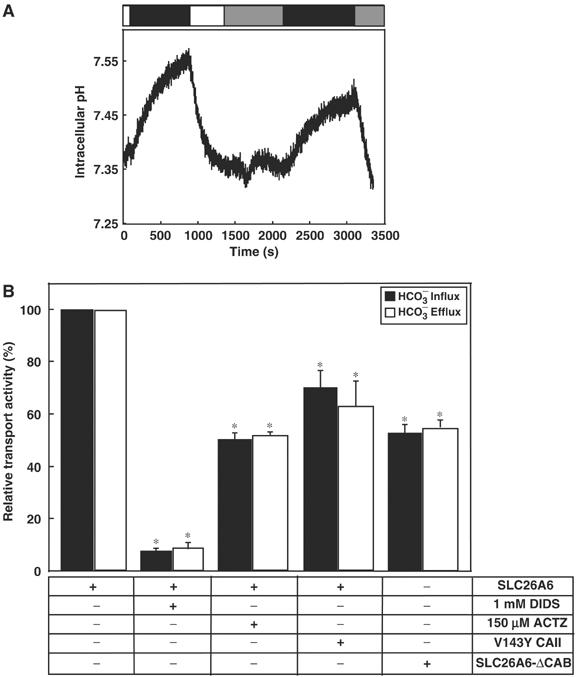
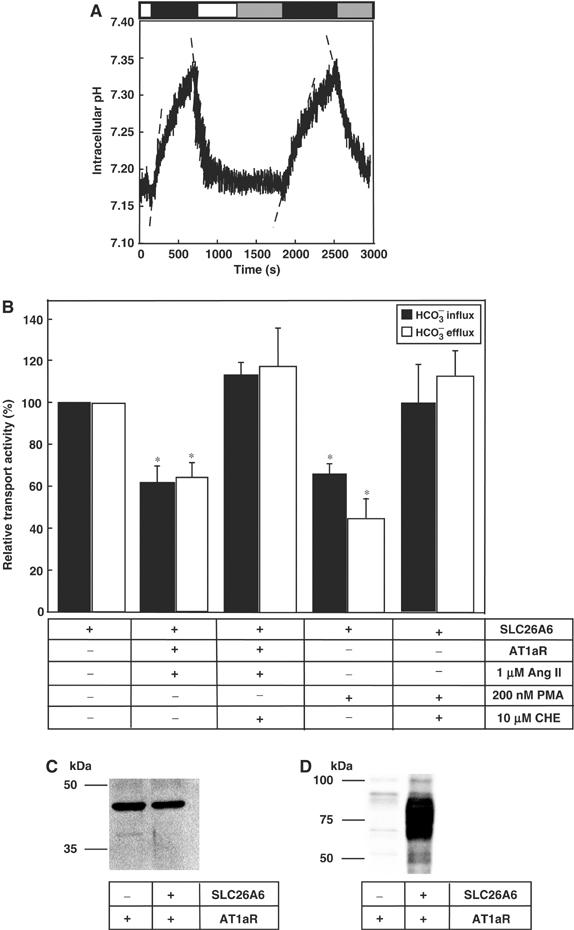
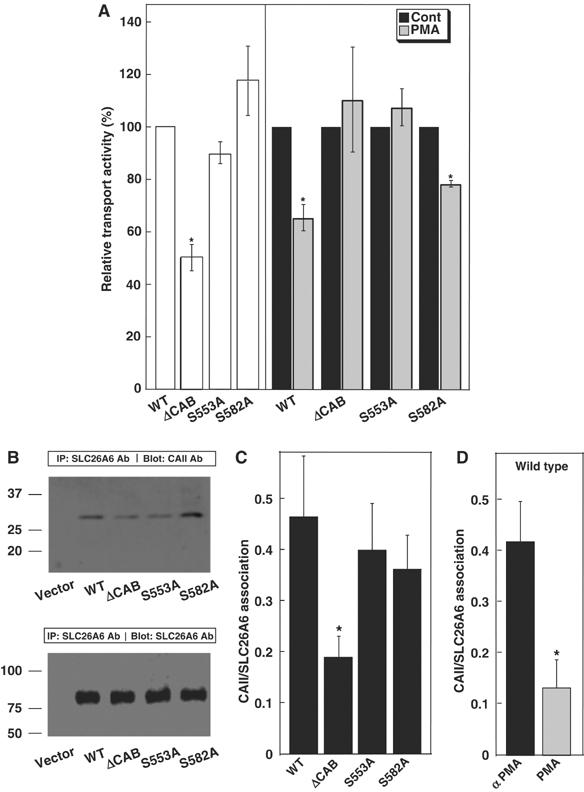
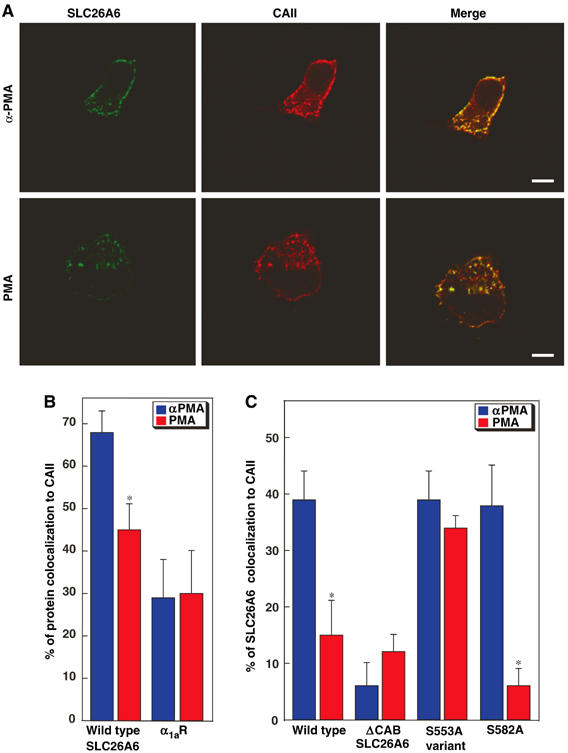
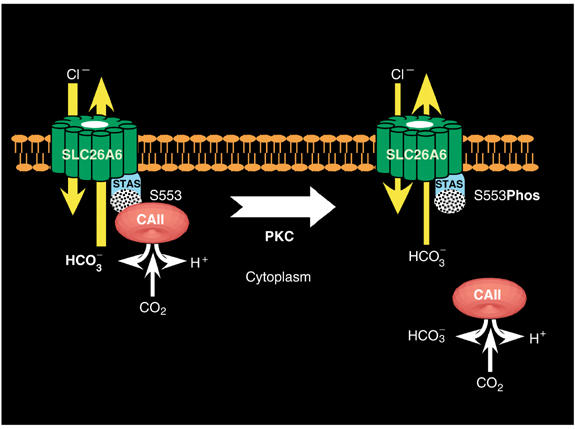
Carbonic anhydrases (CA) catalyze the reversible conversion of CO2 to HCO3-. Some bicarbonate transporters bind CA, forming a complex called a transport metabolon, to maximize the coupled catalytic/transport flux. SLC26A6, a plasma membrane Cl-/HCO3- exchanger with a suggested role in pancreatic HCO3- secretion, was found to bind the cytoplasmic enzyme CAII. Mutation of the identified CAII binding (CAB) site greatly reduced SLC26A6 activity, demonstrating the importance of the interaction. Regulation of SLC26A6 bicarbonate transport by protein kinase C (PKC) was investigated. Angiotensin II (AngII), which activates PKC, decreased Cl-/HCO3- exchange in cells coexpressing SLC26A6 and AT1a-AngII receptor. Activation of PKC reduced SLC26A6/CAII association in immunoprecipitates. Similarly, PKC activation displaced CAII from the plasma membrane, as monitored by immunofluorescence. Finally, mutation of a PKC site adjacent to the SLC26A6 CAB site rendered the transporter unresponsive to PKC. PKC therefore reduces CAII/SLC26A6 interaction, reducing bicarbonate transport rate. Taken together, our data support a mechanism for acute regulation of membrane transport: metabolon disruption.


Figures

Figure 1
Figure 1
SLC26A6 C-terminal region interacts with CAII. (A) Amino-acid sequence alignment of human bicarbonate transport proteins, SLC26A6 (GenBank AF279265), and SLC26A3 (GenBank L02785). Shading indicates sequence identity (black) and sequence similarity (gray). Potential CAII-binding sites, consisting of a hydrophobic residue followed by four residues, two of which are acidic, are indicated (black overline). Asterisks mark consensus PKC phosphorylation sites (Expert Protein Analysis System, http://ca.expasy.org/). (B–C) In all, 10 μg of either GST alone (1) or GSTA6-Q497D633 (2) were resolved by SDS–PAGE on 10% acrylamide gels and transferred to PVDF membranes. Blots were incubated with a lysate of HEK293 cells, which endogenously express CAII. Blots were then probed with anti-CAII antibody (B) or anti-GST antibody (C). Arrowheads indicate the migration positions of GST alone (open) and GSTA6-Q496-D633 (filled).
Figure 2
Figure 2
Identification of the CAII-binding site in the C-terminal region of SLC26A6. (A) CAII, immobilized on a microtiter dish, was incubated with various concentrations of GST (squares) or GSTA6–Q496–D633 (circles). Bound GST, or GST-fusion protein was detected by an enzyme-linked immunosorbant assay. (B) GST fusion proteins correspond to the entire SLC26A6 C-terminus (Q497-D633) and regions progressively truncated from the N-terminus, as indicated in the diagram. Truncation mutants were designed to include different consensus CAII-binding motifs (boxes). (C) Plate-immobilized CAII was incubated with various concentrations of SLC26A6 C-terminal GST-fusion proteins Q497–D633 (•), A531–D633 (▪), L570–D633 (♦) and N602–D633 (▴), and binding was monitored. GST-alone binding has been subtracted.
Figure 3
Figure 3
Inhibition of SLC26A6 Cl/HCO3 exchange activity by manipulation of CA. (A) HEK293 cells, individually transfected with SLC26A6, SLC26A6-ΔCAB, or cotransfected with SLC26A6 and V143Y CAII cDNAs, were loaded with BCECF-AM. Cells were perfused alternately with Cl-containing (open bar) and Cl-free (black bar) Ringer's. In some experiments, cells were incubated with 1 mM DIDS between the first and second cycles of buffer switching. SLC26A6-transfected HEK293 cells were switched from Cl-containing to Cl-free Ringer's buffer and the process was repeated, but in the presence of the membrane-permeant CA inhibitor 150 μM ACTZ (gray bar). (B) Cl/HCO3 exchange activity, relative to WT SLC26A6, for SLC26A6 or SLC26A6-ΔCAB expressed alone or coexpressed with functionally inactive V143Y CAII (n=4–6). *P<0.05. Rates were measured during HCO3 influx (black bars) and HCO3 efflux (white bars).
Figure 4
Figure 4
PKC activation inhibits SLC26A6 Cl/HCO3 exchange activity. (A) HEK293 cells were cotransfected with human SLC26A6 and AT1a-AngII receptor, cDNAs. At 48 h after transfection, Cl/HCO3 anion exchange assays were performed before, and 10 min after exposure to AngII (1 μM, gray bar). HEK293 cells were exposed to medium containing Cl (open bar) or Cl-free medium (black bar), to drive the exchange of Cl for HCO3. Initial rates of change of pHi during the first 100 s were estimated by linear regression (dashed line). (B) Mean values of anion transport activity relative to cells expressing SLC26A6 alone. Cells expressing AT1a receptors were exposed to AngII (1 μM) either in the absence or presence of the PKC inhibitor, CHE (10 μM). SLC26A6-expressing cells were also exposed to 10 min treatment with PMA, either in the presence or the absence of the PKC inhibitor, CHE (10 μM). Rates were measured during HCO3 influx (black bars) and HCO3 efflux (white bars). *P<0.05, n=4–5. (C) HEK293 cells were either transfected with AT1aR cDNA, or cotransfected with SLC26A6 and AT1aR cDNAs. Samples were analyzed by SDS–PAGE, transferred to PVDF membranes, and probed with either anti-AT1aR antibody (C) or anti-SLC26A6 antibody (D).
Figure 5
Figure 5
Identification of the PKC-responsive site in the SLC26A6 C-terminal region. (A) HEK293 cells transfected with WT SLC26A6 cDNA or the indicated mutants were switched from Cl-containing to Cl-free Ringer's buffer and the process was repeated after 10 min incubation with 200 nM PMA. Open bars indicate Cl/HCO3 exchange activity, relative to WT SLC26A6 for samples not treated with PMA. Transport activity before (black bars) and after (grey bars) PMA treatment was normalized to the activity of associated with each cell type, under control conditions. *P<0.05, n=4. (B) HEK293 cells were transfected with vector alone, WT, ΔCAB, S553A or S582A SLC26A6, as indicated. Cell lysates wre immunoprecipitated with anti-SLC26A6 antibody and immunoprecipitates were probed for associated CAII on immunoblots probed with anti-CAII antibody (upper panel). The amount of SLC26A6 present in each sample was assessed on parallel blots probed with anti-SLC26A6 antibody (lower panel). (C) Immunoprecipitation of CAII with SLC26A6 variants was calculated as (amount of CAII/amount of SLC26A6). (D) The effect of PMA on CAII/SLC26A6 association was measured as in panels B and C, except that SLC26A6-expressing cells were incubated with either 200 nM αPMA (black bar) or PMA (grey bar) for 1 h prior to cell lysis. *P<0.05.
Figure 6
Figure 6
Effect of PKC activation on CAII cellular localization. HEK293 cells, transfected with an SLC26A6 variant or with the α1a adrenergic receptor (α1aR), were plated on glass slides. Cells were incubated for 1 h with either PMA, or the biologically inactive α-PMA isomer. (A) In WT-SLC26A6, transfected cells were stained with rabbit anti-SLC26A6 antibody, followed by Alexa Fluor 488-conjugated chicken anti-rabbit IgG secondary antibody (SLC26A6, green) or with goat anti-CAII antibody, followed by Alexa Fluor 594-conjugated chicken anti-goat IgG (CAII, red). Colocalization of CAII and SLC26A6 is yellow (merge). Images were collected with a Zeiss LSM 510 laser-scanning confocal microscope. Scale bar=10 μm. (B) Images were analyzed with MetaMorph® Software to quantify the degree of CAII colocalization with either SLC26A6 or α1aR, in cells treated with PMA (red bars) or αPMA (blue bars). *P<0.05 (n=7–20 cells). (C) Colocalization of SLC26A6 variants with endogenous CAII. Values in this panel were corrected for background colocalization represented by the value of α1aR. *P<0.05.
Figure 7
Figure 7
Regulation of SLC26A6 bicarbonate transport by metabolon disruption. CAII binds the CAB site (stippled) within the STAS domain of SLC26A6. Localization of CAII to the CAB site maximizes the local HCO3 concentration at the SLC26A6 transport site, thereby maximizing transport rate. PKC phosphorylates SLC26A6 at S553, which displaces CAII from the CAB site. Isolation of CAII from the surface of SLC26A6 reduces the local concentration of HCO3, reducing the transport rate. Arrows on the SLC26A6 image represent the movement of Cl and HCO3, where the arrow width indicates the relative rate in each case.
Figure 8
Figure 8
Structural basis for regulation of SLC26A6 by PKC: the STAS domain. (A) Multiple sequence alignment of the amino-acid sequence of a surface loop (yellow) in the STAS domain of human (h) SLC26A1–SLC26A11 (hA1–hA11) and the sporulation-specific sigma factor of B. subtilis, SPOIIAA. Conserved residues (black boxes) and conservative replacements (gray boxes) are indicated. The sequence for loop residues in SPOIIAA is highlighted (green). The CAII-binding site (red) and consensus PKC phosphorylation site (blue) are present only in SLC26A6. (B) Structural model of the STAS domain from SPOIIAA (PDB code 1BUZ) (Kovacs et al, 1998). Yellow structure highlighted with an arrow indicates the position of the variable loop between helix 1 and strand 3 (corresponding to the sequence highlighted in yellow in panel A). Cylinders represent α-helices and arrows represent β-sheets. N, amino-terminus; C, carboxyl-terminus. (C) Space-filling model of SPOIIAA oriented as in panel B. Loop region residues are yellow, while positive and negative residues are blue and red, respectively. Structures were rendered with Cn3D software.

References

    1. Alvarez BV, Fujinaga J, Casey JR (2001a) Molecular basis for angiotensin II-induced increase of chloride/bicarbonate exchange in the myocardium. Circ Res 89: 1246–1253 - PubMed
    1. Alvarez BV, Kieller DM, Quon AL, Markovich D, Casey JR (2004) Slc26a6: a cardiac chloride–hydroxyl exchanger and predominant chloride–bicarbonate exchanger of the mouse heart. J Physiol 561: 721–734 - PMC - PubMed
    1. Alvarez BV, Loiselle FB, Supuran CT, Schwartz GJ, Casey JR (2003) Direct extracellular interaction between carbonic anhydrase IV and the human NBC1 sodium/bicarbonate co-transporter. Biochemistry 42: 12321–12329 - PubMed
    1. Alvarez L, Fanjul M, Carter N, Hollande E (2001b) Carbonic anhydrase II associated with plasma membrane in a human pancreatic duct cell line (CAPAN-1). J Histochem Cytochem 49: 1045–1053 - PubMed
    1. Aravind L, Koonin EV (2000) The STAS domain—a link between anion transporters and antisigma-factor antagonists. Curr Biol 10: R53–R55 - PubMed

Publication types

MeSH terms