. 2005 Sep 1;567(Pt 2):505-21.
doi: 10.1113/jphysiol.2005.085951. Epub 2005 Jun 30.

The aminoglycoside antibiotic dihydrostreptomycin rapidly enters mouse outer hair cells through the mechano-electrical transducer channels

Affiliations

The aminoglycoside antibiotic dihydrostreptomycin rapidly enters mouse outer hair cells through the mechano-electrical transducer channels

Walter Marcotti et al. J Physiol. .

Abstract

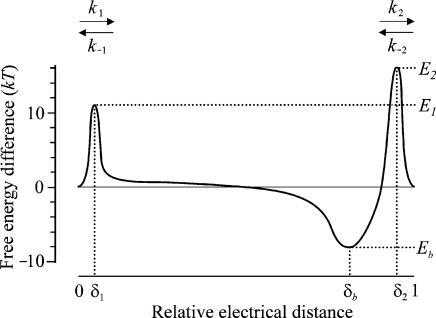
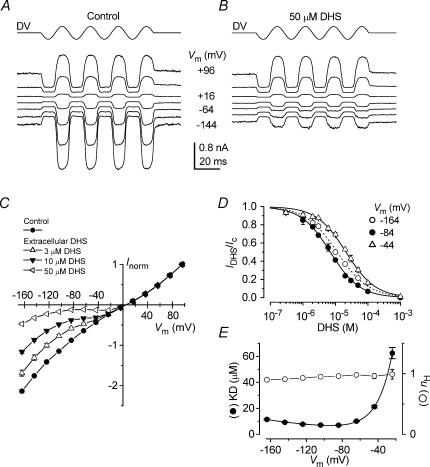
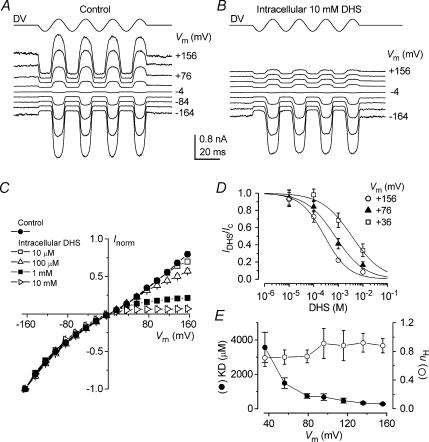
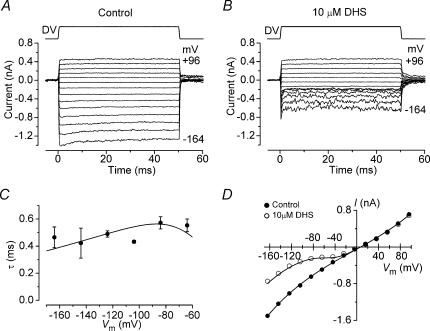
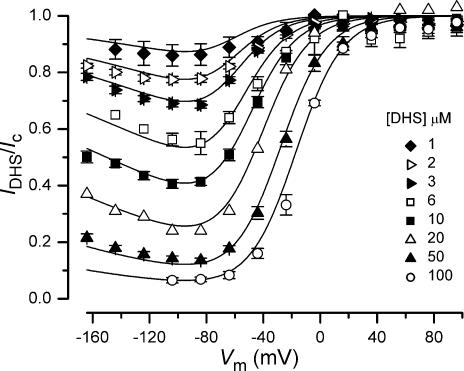
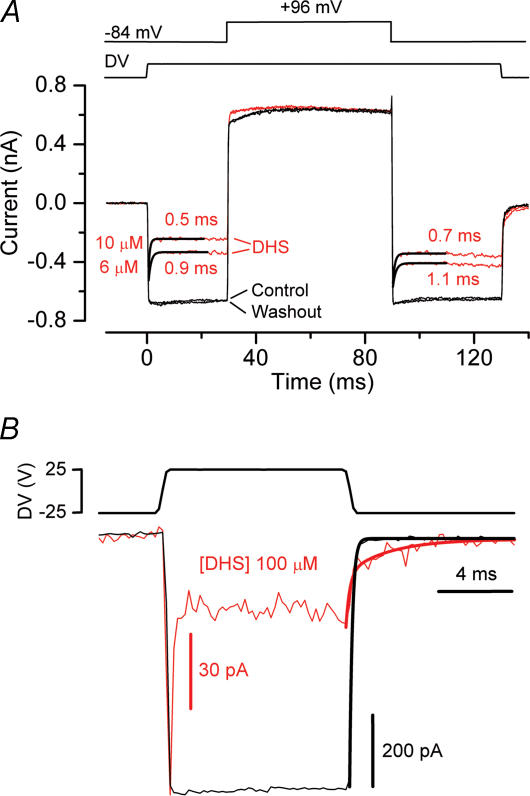
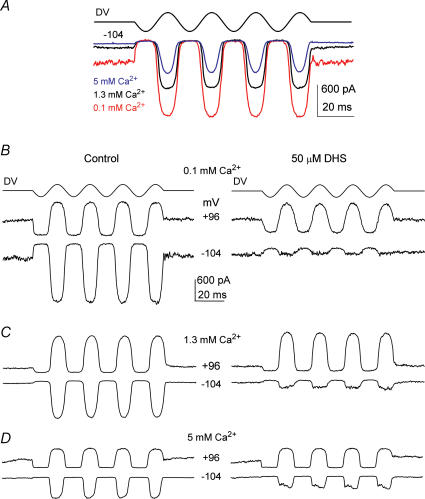
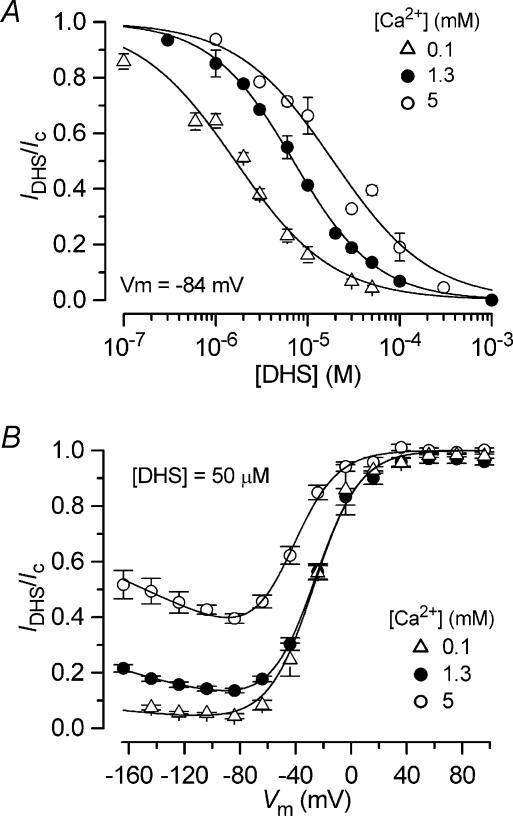
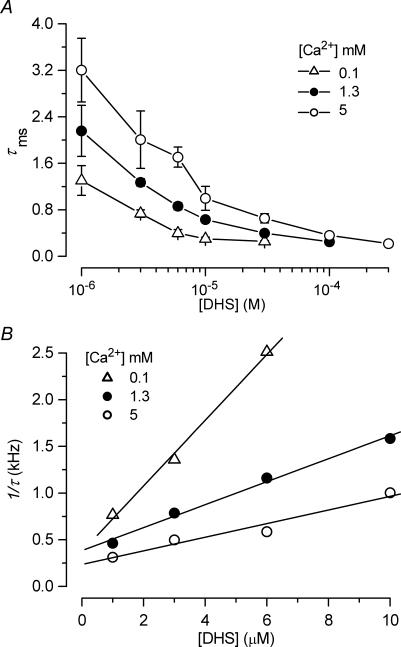
The most serious side-effect of the widely used aminoglycoside antibiotics is irreversible intracellular damage to the auditory and vestibular hair cells of the inner ear. The mechanism of entry into the hair cells has not been unequivocally resolved. Here we report that extracellular dihydrostreptomycin not only blocks the mechano-electrical transducer channels of mouse outer hair cells at negative membrane potentials, as previously shown, but also enters the cells through these channels, which are located in the cells' mechanosensory hair bundles. The voltage-dependent blocking kinetics indicate an open-channel block mechanism, which can be well described by a two barrier-one binding site model, quantifying the antibiotic's block of the channel as well as its permeation in terms of the associated rate constants. The results identify the open transducer channels as the main route for aminoglycoside entry. Intracellularly applied dihydrostreptomycin also blocks the transducer channels, but at positive membrane potentials. However, the potency of the block was two orders of magnitude lower than that due to extracellular dihydrostreptomycin. Extracellular Ca2+ increases the free energy of the barrier nearest the extracellular side and of the binding site for dihydrostreptomycin. This reduces both the entry of dihydrostreptomycin into the channel and the channel's affinity for the drug. In vivo, where the extracellular Ca2+ concentration in the endolymph surrounding the hair bundles is < 100 microM, we predict that some 9000 dihydrostreptomycin molecules per second enter each hair cell at therapeutic drug concentrations.


Figures

Figure 1
Figure 1. Energy profile of the two barrier–one binding site model used to describe the blockage and permeation of the hair cell transducer channel by dihydrostreptomycin
In the absence of a voltage across the membrane (Vm= 0), the two barriers have estimated free energies E1 (11.05 kT) and E2 (15.68 kT) above the free energy level of the minima at the extra- and intracellular sides of the membrane. The barriers are located at relative electrical distances δ1 (range 0–0.09) and δ2 (range 0.91–1), as measured across the membrane from the extracellular side. The two barriers sandwich the binding site of DHS with a minimum in free energy, Eb (−8.27 kT), below zero. The binding site is located at a relative electrical distance δb of 0.79, measured from the extracellular side. Relative electrical positions across the membrane of the two barriers and the binding site, as well as their respective energies are drawn according to values found from fitting these model parameters in 1.3 mm Ca2+.
Figure 2
Figure 2. Extracellular dihydrostreptomycin blocks the OHC transducer channel
A and B, transducer currents recorded from an apical P7 OHC before (A) and during (B) the superfusion of 50 μm dihydrostreptomycin (DHS) when sinusoidal force stimuli of 45 Hz were used. The cell was held at −84 mV and the membrane potential was stepped, in 20 mV increments, between −144 mV and +96 mV. For clarity only responses to every other voltage step are shown. Driver voltage (DV, amplitude 35 V) to the fluid jet is shown above the traces. Positive DVs are excitatory. Membrane potentials are shown next to some of the traces. Recordings in A and B are the average of 4 repetitions and are offset so that the zero-transducer current levels (responses to inhibitory stimuli) are equally spaced. Cm 6.0 pF; Rs 0.8 MΩ. C, average normalized current–voltage curves for the control transducer currents (n = 30) and the current recorded during the superfusion of 3 μm (n = 9), 10 μm (n = 8) and 50 μm (n = 13) DHS (1.3 mm extracellular Ca2+), when both sine waves and voltage step stimuli were used. Note that the currents have been normalized to the maximal current recorded at +96 mV (Control: 878 ± 36 pA; 3 μm: 980 ± 55 pA; 10 μm: 708 ± 73 pA; 50 μm: 924 ± 61 pA). D, dose–response curves for the block of the transducer current by DHS at three different membrane potentials obtained from 35 apical-coil OHCs. Continuous lines are the fits through the data using eqn (4). Fit at −164 mV: half blocking concentration (KD) = 11.4 ± 0.6 μm, Hill coefficient (nH) = 0.90 ± 0.03 (number of measurements from left to right: 1, 10, 9, 4, 1, 10); −84 mV: KD= 7.0 ± 0.2 μm, nH= 0.96 ± 0.03 (2, 3, 12, 9, 4, 8, 1, 5, 13, 6, 1); −44 mV: KD= 21.2 ± 0.9 μm, nH= 0.96 ± 0.04 (number of measurements as for −84 mV). E, average KD and nH plotted as a function of the membrane potential. Number of measurements: 35 at −164 mV; 50 at −144 mV and −24 mV and 64 for all other potentials tested. The fit through the KD data points is according to eqn (2) with: ΔE =E2E1= 4.63 kT, Δδ=δ2−δ1= 0.91, Eb=−8.27 kT and δb= 0.79.
Figure 3
Figure 3. Block of the transducer channel by intracellular dihydrostreptomycin
A and B, transducer currents recorded from apical P7 OHCs in the absence (A) and presence (B) of 10 mm DHS in the intracellular solution and 1.3 mm Ca2+ in the extracellular solution. The cells were held at −84 mV and the membrane potential was stepped, in 20 mV increments, between −164 mV and +156 mV. For clarity only responses to every other voltage step are shown. Driver voltage to the fluid jet was 35 V. Recordings in A and B are averaged from 2 and 3 repetitions, respectively, and are offset so that the zero-transducer current levels (responses to inhibitory stimuli) are equally spaced. A: Cm 5.9 pF; Rs 1.6 MΩ. B: Cm 5.5 pF; Rs 2.0 MΩ. C, normalized current–voltage curves for the transducer currents recorded in the absence (control, n = 7) and in the presence of DHS (10 μm: n = 5; 100 μm: n = 5; 1 mm: n = 6; 10 mm: n = 3) in the intracellular solution, including those shown in A and B. Currents have been normalized to the maximal current recorded at −164 mV (Control: −1417 ± 79 pA; 10 μm: −1437 ± 141 pA; 100 μm: −1367 ± 107 pA; 1 mm: −1294 ± 124 pA; 10 mm: −1271 ± 76 pA). D, dose–response curves for the block of the transducer current by intracellular DHS at three different membrane potentials obtained from 19 apical OHCs. Continuous lines are fits through the data using eqn (4). Fit at +156 mV: KD= 277 ± 44 μm, nH= 0.88 ± 0.10; +76 mV: KD= 742 ± 131 μm, nH= 0.73 ± 0.09; +36 mV: KD= 3567 ± 881 μm, nH= 0.71 ± 0.12 (number of measurements from left to right: 5, 5, 4, 3). E, average KD and nH plotted as a function of the membrane potential including those shown in D. Number of measurements as in D.
Figure 4
Figure 4. Time-dependent block of the transducer current by dihydrostreptomycin
A and B, saturating transducer currents elicited in an apical P7 OHC before (A) and during (B) the superfusion of 10 μm DHS in response to a series of excitatory steps (DV, 25 V). The holding current before the onset of mechanical steps (t = 0 ms) was set to 0 pA. Cm 5.6 pF; Rs 2.8 MΩ. C, time constant of the transducer current relaxation in the presence of 10 μm DHS as a function of membrane potential (P7, n = 4). The fit through the data is according to the two barrier–one binding site model used to describe the nature of the block throughout the paper (eqn (3) in Methods). The fitted parameters are E1= 11.13 kT and E2= 16.34 kT, Eb=−8.27 kT, Δδ=δ2−δ1= 0.91, and δb= 0.79. D, current–voltage curves, constructed by subtracting steady-state currents in response to inhibitory steps from the excitory responses shown in A and B (1.3 mm extracellular Ca2+). For the control current the continuous line through the data is fitted using a single energy barrier model for Ca2+ binding (eqn (5)): Vrev=+6.9 mV, Vrect= 55 mV, Is= 363 pA, γ= 0.48 (n = 43). In the presence of 10 μm DHS the fit through the data was achieved by multiplying the fit to the control currents (eqn (5)) by the blocked fraction prescribed by the two barrier-one binding site model for DHS binding to the channel (eqns (1) and (2), see Methods). Fitting parameters for the DHS-binding model as for Fig. 2E.
Figure 5
Figure 5. Voltage-dependent block of the transducer current by dihydrostreptomycin
Transducer currents recorded in the presence of different concentrations of DHS plotted as a fraction of the current in the control solution. OHC bundles were stimulated by either force steps or sinusoids. Continuous lines are fits according to eqns (1) and (2). The data obtained at all DHS concentrations are fitted using the same values as used for Fig. 2E. Number of cells are: 3 (1 μm), 12 (2 μm), 9 (3 μm), 4 (6 μm), 8 (10 μm), 1 (20 μm), 13 (50 μm), 6 (100 μm). Data for 3 μm, 10 μm and 50 μm same as in Fig. 2C.
Figure 6
Figure 6. Extracellular dihydrostreptomycin is an open-channel blocker of the transducer channel
A, voltage jump experiment in a P7 OHC, before (average of 6 repetitions) and during superfusion of 6 μm and 10 μm (10 averages each) of DHS. Between the applications of each drug concentration, the cell was superfused with a drug-free solution. The washout refers to the end of the experiment (6 repetitions). The OHC was held at a membrane potential of −84 mV and voltage stepped to +96 mV during the application of a 35 V mechanical step. Electrical stimuli and a combination of mechanical and electrical stimuli were alternated. Currents shown are the result of subtracting responses to electrical stimuli alone from the combination of both stimuli to eliminate linear leak and voltage-dependent currents. Cm 6.7 pF; Rs 5.6 MΩ. B, transducer channels were first closed by inhibitory bundle displacement (DV: −25 V; first 3 ms). Then, a large saturating current was elicited by stimulating the bundles in the excitatory direction (DV, +25 V) at the holding potential of −84 mV. The P6 OHC was first superfused in drug-free solution and then with 100 μm DHS. The peak current was −711 pA for the control current and −107 pA for current in the presence of the drug (both average of 10 repetitions). The tail currents at the end of the excitatory step were fitted by a single exponential (control, τ= 0.14 ms) or a double exponential (100 μm DHS, τfast= 0.20 ms, τslow= 2.27 ms), superimposed on the data. Cm 6.2 pF; Rs 3.6 MΩ.
Figure 7
Figure 7. The block of the transducer channel by dihydrostreptomycin is Ca2+ dependent
A, transducer currents in a P6 OHC elicited by sinusoidal force stimuli of 45 Hz (DV, amplitude 35 V) at a potential of −104 mV, using 0.1 mm (red trace), 1.3 mm (black trace) and 5 mm (blue trace) extracellular Ca2+. Note that the sizes of both the maximum and the resting transducer current change with the extracellular Ca2+ concentration. Cm 6.8 pF; Rs 2.6 MΩ. B–D, transducer currents recorded (DV: 35 V) in the presence of different extracellular Ca2+ concentrations before (left column) and during (right column) superfusion of 50 μm DHS. The OHCs were held at −84 mV and the membrane potential was stepped between −104 mV and +96 mV in 20 mV increments. For clarity only responses to −104 mV and +96 mV voltage steps are shown. All records are single traces. B, P7 Cm 6.3 pF; Rs 2.1 MΩ. C, P5 Cm 6.2 pF; Rs 5.3 MΩ. D, P6 Cm 6.5 pF; Rs 5.6 MΩ.
Figure 8
Figure 8. Extracellular Ca2+ reduces the potency of the block of the transducer channel by dihydrostreptomycin
A, dose–response curves for the block of the transducer current by DHS during the superfusion of 0.1 mm (n = 22), 1.3 mm (n = 35) and 5 mm (n = 25) Ca2+ at a membrane potential of −84 mV. The fitted parameters (eqn (4)) are: 0.1 mm Ca2+: KD= 1.6 ± 0.1 μm, nH= 0.82 ± 0.05 (number of measurements from left to right: 5, 4, 6, 3, 5, 5, 4, 5, 3); 1.3 mm Ca2+: as in Fig 2D; and 5 mm Ca2+: KD= 19.0 ± 1.5 μm, nH= 0.83 ± 0.05 (8, 4, 9, 6, 7, 7, 3, 4). B, averaged normalized transducer currents, including those shown in Fig. 7BD, recorded in the presence of 50 μm DHS and different extracellular Ca2+ concentrations plotted as a fraction of the control currents (IDHS/Ic). The fits through the data are according to eqns (1) and (2) in which Δδ (0.91) and δb (0.79) were kept constant as in Fig. 5, but with different values of ΔE (0.1 mm Ca2+: 5.84 kT; 5 mm Ca2+: 4.34 kT) and Eb (0.1 mm Ca2+: −8.24 kT; 5 mm Ca2+: −6.94 kT).
Figure 9
Figure 9. The kinetics of dihydrostreptomycin entering the transducer channel are slowed by extracellular Ca2+
A, decay time constant of the current recorded at a membrane potential of −84 mV during superfusion with different DHS concentrations in the presence of 0.1 mm (n = 17), 1.3 mm (n = 34) and 5 mm (n = 11) Ca2+. Numbers of measurements from left to right are: 0.1 mm Ca2+ 5, 5, 5, 6, 5; 1.3 mm Ca2+ 6, 6, 7, 18, 7, 10; 5 mm Ca2+ 5, 3, 6, 3, 4, 3, 4. B, analysis of DHS-binding kinetics to obtain the rate-constant k1. The inverse of the time constant of binding (1/τ) as a function of [Do] was evaluated to obtain the rate-constant k1 (eqn (3)). Continuous lines indicate the slopes at 0.1 mm Ca2+ (open triangles, 3.52 × 10⁸ s−1· m−1), 1.3 mm Ca2+ (filled circles, 1.23 × 10⁸ s−1· m−1) and 5 mm Ca2+ (open circles, 0.73 × 10⁸ s−1· m−1). The holding potential was −84 mV in all experiments.

Comment in

References

    1. Armstrong CM. Time course of TEA+-induced anomalous rectification in squid giant axons. J General Physiol. 1966;50:491–503. - PMC - PubMed
    1. Assad JA, Hacohen N, Corey DP. Voltage dependence of adaptation and active bundle movement in bullfrog saccular hair cells. Proc Natl Acad Sci U S A. 1989;86:2918–2922. - PMC - PubMed
    1. Bähring R, Bowie D, Benveniste M, Mayer ML. Permeation and block of rat GluR6 glutamate receptor channels by internal and external polyamines. J Physiol. 1997;502:575–589. - PMC - PubMed
    1. Bernard C. Action of streptomycin and calcium on the apical membrane of hair cells of the frog isolated semicircular canal. Acta Otolaryngol. 1983;96:21–30. - PubMed
    1. Blanchet C, Erostegui C, Sugasawa M, Dulon D. Gentamicin blocks ACh-evoked K+ current in guinea-pig outer hair cells by impairing Ca2+ entry at the cholinergic receptor. J Physiol. 2000;525:641–654. - PMC - PubMed

Publication types

MeSH terms