

Comparative Study
doi: 10.1073/pnas.0502917102.
Epub 2005 Jun 30.
Single-molecule studies of repressor-DNA interactions show long-range interactions
Affiliations
- PMID: 15994229
- PMCID: PMC1168954
- DOI: 10.1073/pnas.0502917102
Item in Clipboard
Comparative Study
Single-molecule studies of repressor-DNA interactions show long-range interactions
Proc Natl Acad Sci U S A.
.
Abstract
We have performed single-molecule studies of GFP-LacI repressor proteins bound to bacteriophage lambda DNA containing a 256 tandem lac operator insertion confined in nanochannels. An integrated photon molecular counting method was developed to determine the number of proteins bound to DNA. By using this method, we determined the saturated mean occupancy of the 256 tandem lac operators to be 13, which constitutes only 2.5% of the available sites. This low occupancy level suggests that the repressors influence each other even when they are widely separated, at distances on the order of 200 nm, or several DNA persistence lengths.
Figures
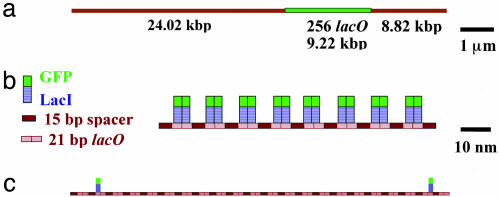
GFP–LacI bound to DNA. (a) Schematic representation of the λ DNA construct with 256 tandem copies of the lacO binding units. LacO256–DNA is 42.06 kbp long, and the 9.22-kbp lacO256 insertion starts at 24.02 kbp. (b) Scaled model of the specific lacO sites with the 5′-AATTGTGAGCGGATAACAATT-3′ sequence, the spacer sequences between them, and the GFP–LacI proteins bound to full occupancy. The dimensions of the LacI and GFP molecules are 3 × 6 nm (2) and 3 × 4 nm (9), respectively. (c) Actual observed occupancy level. Only 2.5% of the available sites were bound.
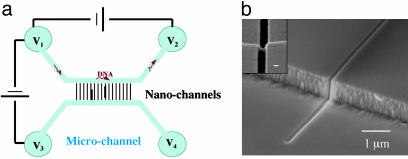
The nanofluidic device. (a) Schematic representations of the microfluidic and nanofluidic device. Blue regions are microchannels, and the bridging black lines are nanochannels where the DNA molecules (red) are elongated. DNA molecules are guided consecutively into microchannels and nanochannels by electrophoresis. (b) SEM images of a 120 × 150 nm (width × height) channel. Inset is a top view of the nanochannel showing its dimensions. (Scale bar for Inset, 100 nm.)
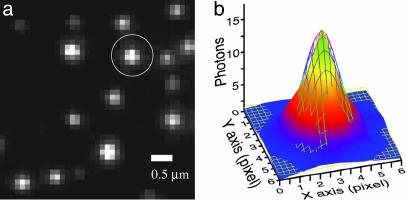
Single GFP–LacI images. (a) Frame-averaged image of single GFP–LacI molecules attached to a fused-silica surface. (b) A 2D-Gaussian fit to the number of emitted photons from the circled GFP–LacI dot in a. The excitation intensity was 300 W/cm2; the image pixel size is 154 nm. The SDs in X and Y directions are σx = 125 nm and σy = 131 nm, respectively. The optical resolution σo is the full width at half maximum of the point spread function, σo = σx × 2.356 = 295 nm.
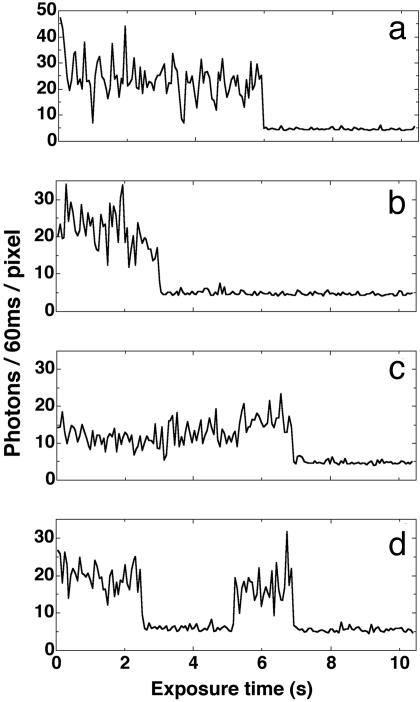
Peak fluorescence intensity vs. time for single GFP–LacI monomers. The continuous-illumination mode was used. The illumination intensity was 300 W/cm2. Each peak photon count value was the pixel-averaged value of the selected center bright pixels of a fluorescence dot. (a and b) The typical frequent blinking and slight decline in intensity was followed by irreversible bleaching. Some molecules exhibited a fluorescence intensity increase after the initial decline as in c. (d) Several molecules showed recovery from the photobleaching in seconds, and then eventually photobleached again, this time irreversibly. The background has a mean of “4.7” photons per pixel per 60 ms of exposure time.
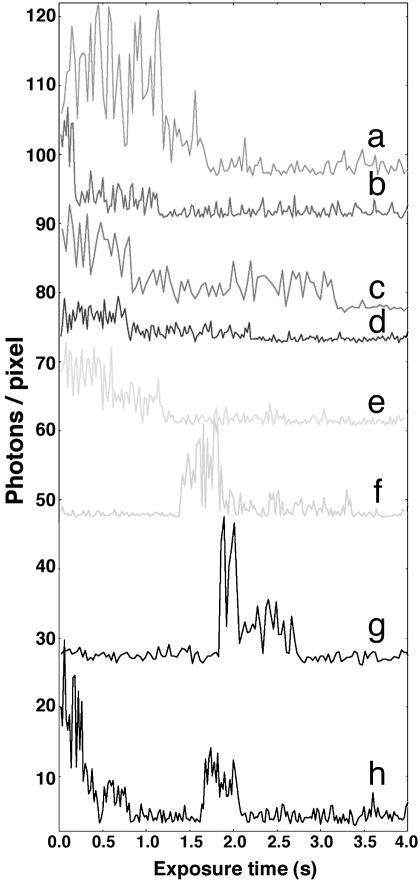
An array of staggered fluorescence time traces of GFP–LacI dimers showing representative raw data. The pulsed-illumination mode with 20-ms (b, d, e, and h), 30-ms (a, f, and g), and 40-ms (c) exposure times and synchronized with 3.4 Hz data acquisition was used. The photon count per pixel was the pixel-averaged counts of photons per exposure time over the typical 4 × 4-pixel area illuminated by the point spread function of a protein. The illumination intensity was 500 W/cm2. Note the representative two sudden intensity drops in all traces; it is the signature of consecutive irreversible bleaching events (except for h, in which both dimers recovered from bleaching) of the two constituent GFP–LacI molecules. The background for all traces has a mean of ≈3.5 photons per pixel per 20- to 40-ms exposure time.
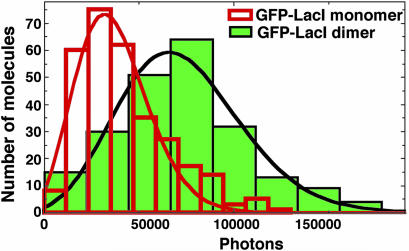
Histogram comparing total photons emitted in the lifetime of single GFP–LacI monomers and dimers. The lines are Poisson fits to the photon distributions; the values of the total emitted photons are (3.69 ± 1.88) × 104 (mean ± SD) for monomers and (7.32 ± 3.19) ×104 for dimers. GFP–LacI dimers emit exactly twice as many photons as monomers, indicating that the GFP–GFP fluorescence self-quenching, if any, is negligible.
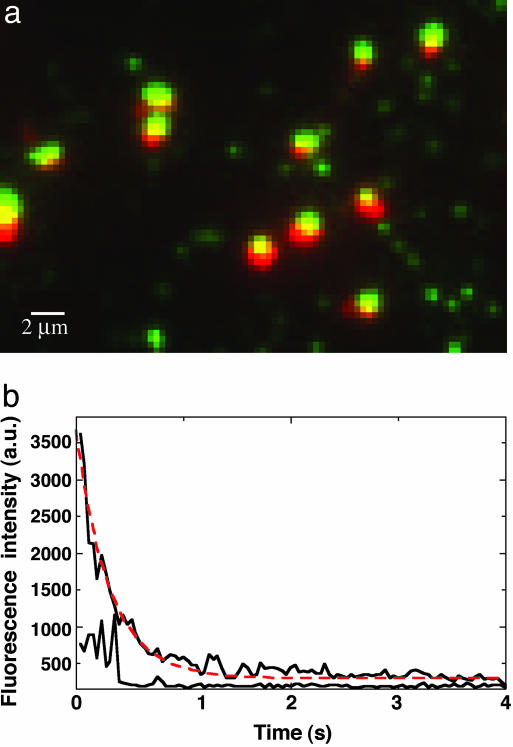
Image- and fluorescence-intensity trace of GFP–LacI bound to lacO256–DNA. The pulsed-illumination mode was used at an intensity of 1,000 W/cm2; the exposure time was 40 ms. (a) GFP–LacI bound to lacO256–DNA attached to fused-silica surface. Superimposed green and red dots are bound LacI–DNA molecules, and independent green dots are single unbound GFP–LacI molecules. The pixel size is 234 nm. (b) Fluorescence-intensity time traces of a bound GFP–LacI dot (7 × 8 pixels) and an unbound GFP–LacI dot (4 × 4 pixels) measured by using the average photon count per pixel of each image. The intensity of the bound GFP–LacI image declines exponentially, obscuring the photobleaching events of individual bound molecules. There are ≈22 molecules bound to lacO256 in this image.
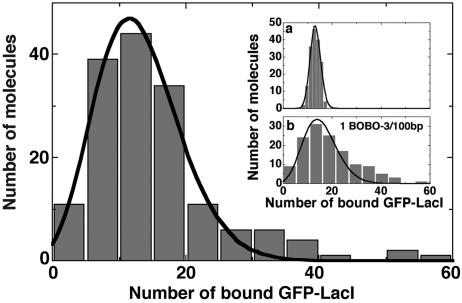
The number of bound GFP–LacI to lacO256–DNA is 13 ± 6 proteins (mean ± SD). Points above 30 are likely lacO256–DNA dimers formed by the sticky end hybridization of two lacO256–DNA monomers. Inset a is the simulated distribution for number of bound GFP–LacI for 13 randomly selected GFP–LacI monomers. Inset b is the number of bound GFP–LacI at the decreased dye concentration of one dye molecule per 100 bp. The number of bound GFP–LacI is 15 ± 7 proteins.
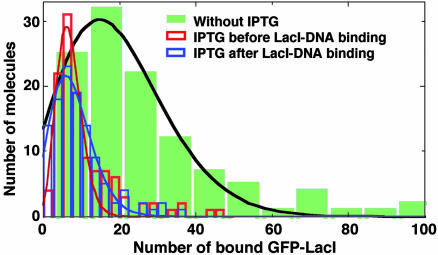
The number of GFP–LacI bound to lacO256–DNA for three different conditions: without IPTG, with 1 mM IPTG added after the LacI–DNA–BOBO-3 binding, and with 1 mM IPTG preincubated with GFP–LacI for 1 h before adding DNA and BOBO-3 dye. The numbers of bound GFP–LacI are 19 ± 13, 8 ± 5, and 7 ± 3 (mean ± SD), respectively.
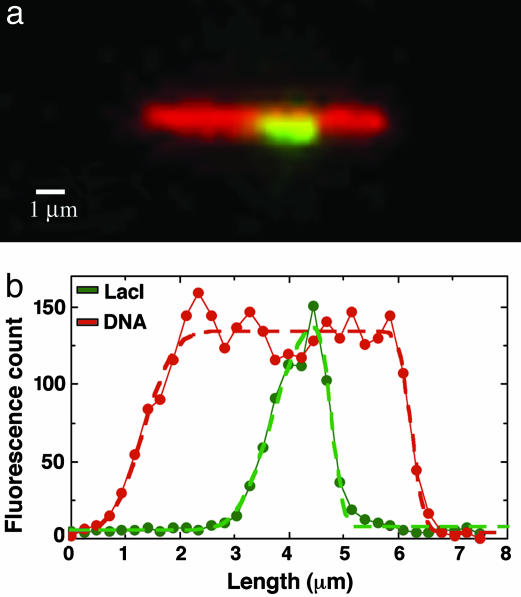
LacI bound to DNA in a nanochannel. (a) Time-averaged image of GFP–LacI bound to lacO256–DNA elongated in a 150 × 200 nm channel. There are ≈20 GFP–LacI molecules bound to this lacO256–DNA molecule. This molecule traveled from right to left into the nanochannel driven by an electric field of 5V/50 μm. (b) Fluorescence intensity profiles for the DNA and the bound GFP–LacI. The fits are dashed lines.
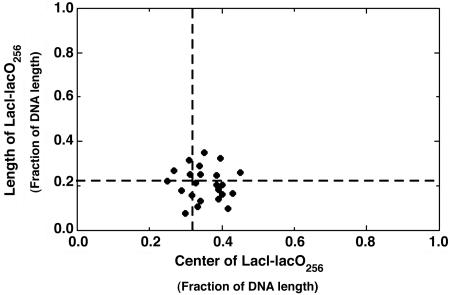
Fractional center locations and fractional lengths of LacI–lacO256 for 24 different samples. The center position is the fractional distance from the center of the LacI-bound DNA to the shorter end of the DNA molecule. The dashed lines mark the fractional center position of 0.32 and the fractional length of 0.22 of the native lacO256 length.
References
-
- Jacob, F. & Monod, J. J. (1961) J. Mol. Biol. 3, 318–356. - PubMed
-
- Lewis, M., Chan, G., Horton, N. C., Kercher, M. A., Pace, H. C., Schumacher, M. A., Brennan, R. G. & Lu, P. (1996) Science 271, 1247–1254. - PubMed
-
- Kalodimos, C. G., Biris, N, Bonvin, A. M. J. J., Levandoski, M. M., Guennuegues, M., Boelens, R. & Kaptein, R. (2004) Science 305, 386–389. - PubMed
-
- Bell, C. E. & Lewis, M. (2000) Nat. Struct. Biol. 7, 209–214. - PubMed
-
- Levandoski, M. M., Tsodikov, O. V., Frank, D. E., Melcher, S. E., Saecker, R. M. & Record, M. T., Jr. (1996) J. Mol. Biol. 260, 697–717. - PubMed
Publication types
MeSH terms
Substances
Grants and funding
LinkOut - more resources
Full Text Sources
Other Literature Sources
Miscellaneous
