Changes in human immunodeficiency virus type 1 fitness and genetic diversity during disease progression
- PMID: 15994794
- PMCID: PMC1168764
- DOI: 10.1128/JVI.79.14.9006-9018.2005
Changes in human immunodeficiency virus type 1 fitness and genetic diversity during disease progression
Abstract
This study examined the relationship between ex vivo human immunodeficiency virus type 1 (HIV-1) fitness and viral genetic diversity during the course of HIV-1 disease. Primary HIV-1 isolates from 10 patients at different time points were competed against control HIV-1 strains in peripheral blood mononuclear cell (PBMC) cultures to determine relative fitness values. Patient HIV-1 isolates sequentially gained fitness during disease at a significant rate that directly correlated with viral load and HIV-1 env C2V3 diversity. A loss in both fitness and viral diversity was observed upon the initiation of antiretroviral therapy. A possible relationship between genotype and phenotype (virus replication efficiency) is supported by the parallel increases in ex vivo fitness and viral diversity during disease, of which the correlation is largely based on specific V3 sequences. Syncytium-inducing, CXCR4-tropic HIV-1 isolates did have higher relative fitness values than non-syncytium-inducing, CCR5-tropic HIV-1 isolates, as determined by dual virus competitions in PBMC, but increases in fitness during disease were not solely powered by a gradual switch in coreceptor usage. These data provide in vivo evidence that increasing HIV-1 replication efficiency may be related to a concomitant increase in HIV-1 diversity, which in turn may be a determining factor in disease progression.
Figures


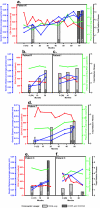
 , >90;
 , >80;
  , >70). Genetic divergence from the consensus sequence at the first timepoint for each patient is shown as synonymous (dS) and nonsynonymous (dN) mutations. The dS/dN ratio within each set of clonal sequences at each time point is also displayed.


 , >90;
 , >80;
  , >70). The boxes highlight terminal nodes from the HIV-1 T0 and T21 sequences within the patient PBMC, i.e., the same PBMC sample used to propagate the viruses. The results of T0 and T21 (c) or I0, I10, and I21 (e) competitions against control strains are presented as individual pie charts. The gray slices represent the percentage of sample virus growth against one of the four control strains, which are represented by black slices (A-92RW009, B-92BR017, A-92UG029, and E-CMU06). Total relative fitness values (W) derived from control virus competitions are indicated in panels c and e. The results from direct competitions between T0 and T21 are shown in panel d. Competitions I0 versus I22 and I10 versus I22 are shown in panel f. Gray and black slices of each pie chart in panels d and f are as labeled in the figure.
References
-
- Asjo, B., L. Morfeldt-Manson, J. Albert, G. Biberfeld, A. Karlsson, K. Lidman, and E. M. Fenyo. 1986. Replicative capacity of human immunodeficiency virus from patients with varying severity of HIV infection. Lancet ii:660-662. - PubMed
-
- Ball, S. C., A. Abraha, K. R. Collins, A. J. Marozsan, H. Baird, M. E. Quinones-Mateu, A. Penn-Nicholson, M. Murray, N. Richard, M. Lobritz, P. A. Zimmerman, T. Kawamura, A. Blauvelt, and E. J. Arts. 2003. Comparing the ex vivo fitness of CCR5-tropic human immunodeficiency virus type 1 isolates of subtypes B and C. J. Virol. 77:1021-1038. - PMC - PubMed
-
- Blaak, H., M. Brouwer, L. J. Ran, F. de Wolf, and H. Schuitemaker. 1998. In vitro replication kinetics of human immunodeficiency virus type 1 (HIV-1) variants in relation to virus load in long-term survivors of HIV-1 infection. J. Infect. Dis. 177:600-610. - PubMed
-
- Borrow, P., H. Lewicki, X. Wei, M. S. Horwitz, N. Peffer, H. Meyers, J. A. Nelson, J. E. Gairin, B. H. Hahn, M. B. Oldstone, and G. M. Shaw. 1997. Antiviral pressure exerted by HIV-1-specific cytotoxic T lymphocytes (CTLs) during primary infection demonstrated by rapid selection of CTL escape virus. Nat. Med. 3:205-211. - PubMed
-
- Brander, C., and B. D. Walker. 2003. Gradual adaptation of HIV to human host populations: good or bad news? Nat. Med. 9:1359-1362. - PubMed
Publication types
MeSH terms
Substances
Grants and funding
LinkOut - more resources
Full Text Sources
Medical
Molecular Biology Databases

