. 2005 Jul;79(14):9270-84.
doi: 10.1128/JVI.79.14.9270-9284.2005.

ERV3 and related sequences in humans: structure and RNA expression

Affiliations

ERV3 and related sequences in humans: structure and RNA expression

Ann-Catrin Andersson et al. J Virol. 2005 Jul.

Abstract

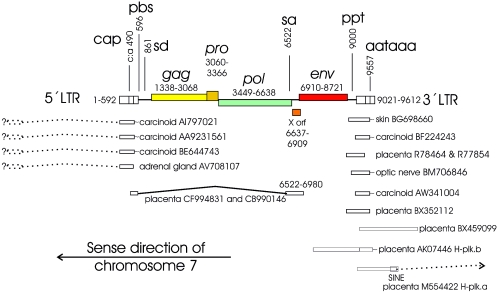
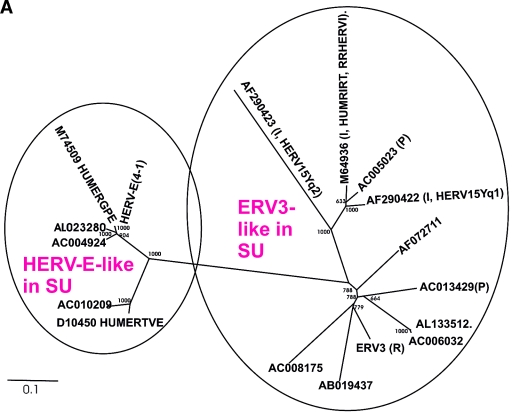
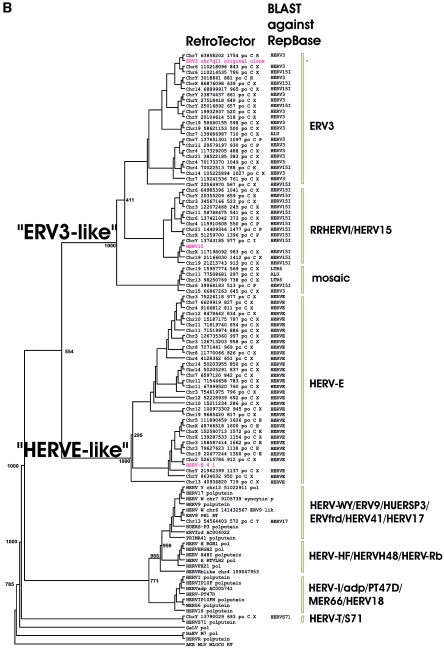
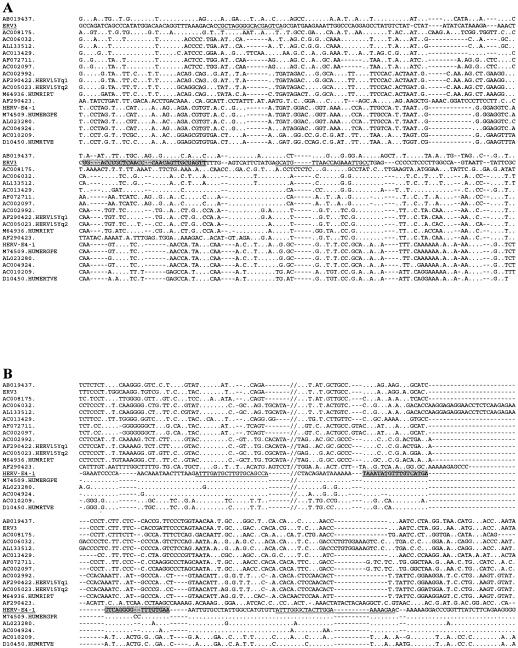
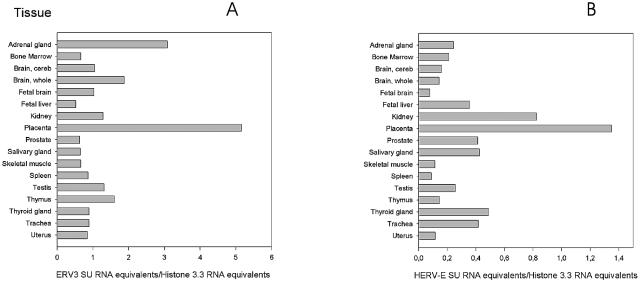
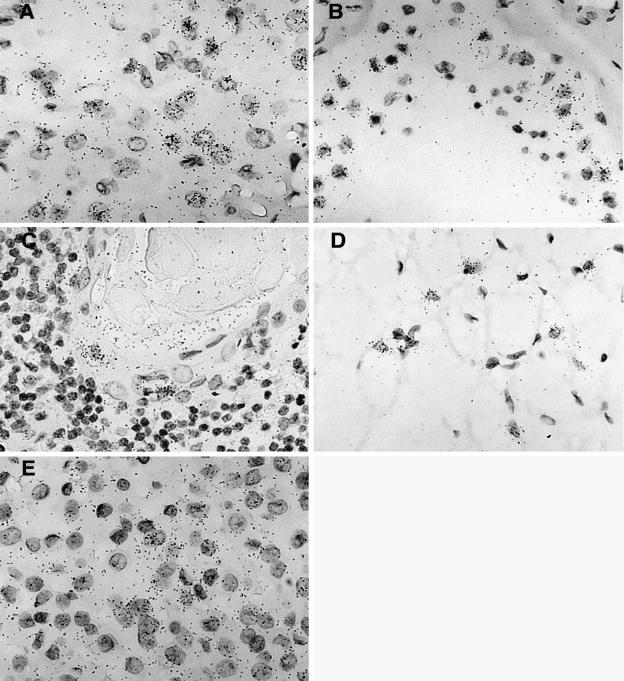
The ERV3 locus at chromosome 7q11 is a much studied human endogenous retroviral (HERV) sequence, owing to an env open reading frame (ORF) and placental RNA and protein expression. An analysis of the human genome demonstrated that ERV3 is one of a group of 41 highly related elements (ERV3-like HERVs) which use proline, isoleucine, or arginine tRNA in their primer binding sites. In addition to elements closely related to ERV3, the group included the previously known retinoic acid-inducible element, RRHERVI, also referred to as HERV15, but was separate from the related HERV-E elements. The ERV3-like elements are defective. The only element with an ORF among gag, pro, pol, and env genes was the env ORF of the original ERV3 locus. A search in dbEST revealed ERV3 RNA expression in placenta, skin, carcinoid tumor, and adrenal glands. Expression was also studied with newly developed real-time quantitative PCRs (QPCR) of ERV3 and HERV-E(4-1) env sequences. Results from a novel histone 3.3 RNA QPCR result served as the expression control. QPCR results for ERV3 were compatible with previously published results, with a stronger expression in adrenal gland and placenta than in 15 other human tissues. The expression of the envelope (env) of ERV3 at chromosome 7q11 was also studied by using stringent in situ hybridization. Expression was found in corpus luteum, testis, adrenal gland, Hassal's bodies in thymus, brown fat, pituitary gland, and epithelium of the lung. We conclude that ERV3 env is most strongly expressed in adrenal and sebaceous glands as well as in placenta.


Figures

FIG. 1.
FIG. 1.
Overview of the ERV3 locus at chromosome 7q11 as interpreted by the RetroTector computer program (G. O. Sperber and J. Blomberg, unpublished data) from the human genome version hg15 (April 2003). Positions of selected ESTs and cDNAs and observed or probable splices (indicated by questions marks) are also shown. Positions are given relative to the first nucleotide of the 5′ LTR. Note that the element is antisense to the ascribed start of chromosome 7. SINE, short interspersed element. Sequences are identified by GenBank accession numbers.
FIG. 2.
FIG. 2.
(A) Dendrogram of ERV3- and HERV-E-like sequences based on the nucleotide alignment of the SU part of env, partly shown in Fig. 3. PBS were analyzed by using the RetroTector program (see Materials and Methods) (G. O. Sperber and J. Blomberg, unpublished data). Sequences with an identifiable PBS are shown in parentheses, giving the amino acid (using the one-letter code) corresponding to parts of the tRNA sequence. (B) Pol amino acid-based cladogram, derived from the alignment shown in Fig. S3a (see the supplemental material). The neighbor-joining method was used. For each element, the following RetroTector-derived data are shown: chromosomal position, chain score, PBS usage, sum of stops and frame shifts, and the most similar RepBase element. The bootstrap value (1,000 replicates) for the branch which divides the ERV3-like and the HERVH HERV-E-like elements is also shown.
FIG. 2.
FIG. 2.
(A) Dendrogram of ERV3- and HERV-E-like sequences based on the nucleotide alignment of the SU part of env, partly shown in Fig. 3. PBS were analyzed by using the RetroTector program (see Materials and Methods) (G. O. Sperber and J. Blomberg, unpublished data). Sequences with an identifiable PBS are shown in parentheses, giving the amino acid (using the one-letter code) corresponding to parts of the tRNA sequence. (B) Pol amino acid-based cladogram, derived from the alignment shown in Fig. S3a (see the supplemental material). The neighbor-joining method was used. For each element, the following RetroTector-derived data are shown: chromosomal position, chain score, PBS usage, sum of stops and frame shifts, and the most similar RepBase element. The bootstrap value (1,000 replicates) for the branch which divides the ERV3-like and the HERVH HERV-E-like elements is also shown.
FIG. 3.
FIG. 3.
Parts of the SU region of the ERV3- and HERV-E-related sequences aligned with the annotated repetitive sequences for HUMRIRT, HUMERGPE, HERV15Yq1, and HERV15Yq2. QPCR primers are indicated for ERV3 (A) and HERV-E (B) in the alignment by underlining and probe sequences are indicated by underlining and shading. Double slashes in the alignment in panel B show where 60 nt were omitted in the figure due to space limitations. Periods denote identity to the master sequence, which is underlined.
FIG. 4.
FIG. 4.
ERV3 (A) and HERV-E (B) env mRNA expression detected by QPCR specific for the SU region of HERV-E and ERV3, respectively. Each value represents a mean of the results for at least two experiments. cDNA from an RNA panel (Clontech) from several human tissues was analyzed. The values for placenta and skeletal muscle are averages based on samples from a commercial tissue RNA panel and RNA extracted from local patient samples, as described in Materials and Methods. All values are expressed relative to the histone 3.3 signal of the same sample. Note that the scale for HERV-E is different from that of ERV3. cereb, cerebellum.
FIG. 5.
FIG. 5.
Hybridization signal obtained with the ERV3 antisense SU probe in five different tissues. (A) Tissue section from a corpus luteum demonstrating a positive and elevated ERV3 signal in progesterone-producing luteinized follicular cells. (B) Positive signal in yet unidentified cells obtained from a tissue section from a human, partly atrophic, testis with reduced spermatogenesis. (C) Tissue section from thymus with an elevated signal in cells in the outer part of a Hassal's body. (D) Brown fat section showing a high ERV3 message in typical multivacuolated brown fat cells. (E) Tissue section from a human pituitary gland (adenohypophysis portion), where an elevated ERV3 message is visible in all cell types.

References

    1. Altschul, S. F., W. Gish, W. Miller, E. W. Myers, and D. J. Lipman. 1990. Basic local alignment search tool. J. Mol. Biol. 215:403-410. - PubMed
    1. Anderson, G. R., D. L. Stoler, and L. A. Scarcello. 1989. Retrotransposon-like VL30 elements are efficiently induced in anoxic rat fibroblasts. J. Mol. Biol. 205:765-769. - PubMed
    1. Andersson, A.-C., M. Merza, P. Venables, F. Ponten, J. Sundström, M. Cohen, and E. Larsson. 1996. Elevated levels of the endogenous retrovirus ERV3 in human sebaceous glands. J. Investig. Dermatol. 106:125-128. - PubMed
    1. Andersson, A.-C., A.-C. Svensson, C. Rolny, G. Andersson, and E. Larsson. 1998. Expression of human endogenous retrovirus ERV3 (HERV-R) mRNA in normal and neoplastic tissues. Int J. Oncol. 12:309-313. - PubMed
    1. Andersson, A.-C., P. J. W. Venables, R. R. Tönjes, J. Scherer, L. Eriksson, and E. Larsson. 2002. Developmental expression of HERV-R (ERV3) and HERV-K in human tissue. Virology 297:220-225. - PubMed

Publication types

LinkOut - more resources