Rosiglitazone ameliorates abnormal expression and activity of protein tyrosine phosphatase 1B in the skeletal muscle of fat-fed, streptozotocin-treated diabetic rats
- PMID: 15997237
- PMCID: PMC1576260
- DOI: 10.1038/sj.bjp.0706306
Rosiglitazone ameliorates abnormal expression and activity of protein tyrosine phosphatase 1B in the skeletal muscle of fat-fed, streptozotocin-treated diabetic rats
Abstract
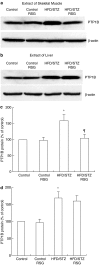
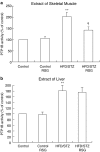
Protein tyrosine phosphatase 1B (PTP1B) acts as a physiological negative regulator of insulin signaling by dephosphorylating the activated insulin receptor (IR). Here we examine the role of PTP1B in the insulin-sensitizing action of rosiglitazone (RSG) in skeletal muscle and liver. Fat-fed, streptozotocin-treated rats (10-week-old), an animal model of type II diabetes, and age-matched, nondiabetic controls were treated with RSG (10 micromol kg(-1) day(-1)) for 2 weeks. After RSG treatment, the diabetic rats showed a significant decrease in blood glucose and improved insulin sensitivity. Diabetic rats showed significantly increased levels and activities of PTP1B in the skeletal muscle (1.6- and 2-fold, respectively) and liver (1.7- and 1.8-fold, respectively), thus diminishing insulin signaling in the target tissues. We found that the decreases in insulin-stimulated glucose uptake (55%), tyrosine phosphorylation of IRbeta-subunits (48%), and IR substrate-1 (IRS-1) (39%) in muscles of diabetic rats were normalized after RSG treatment. These effects were associated with 34 and 30% decreases in increased PTP1B levels and activities, respectively, in skeletal muscles of diabetic rats. In contrast, RSG did not affect the increased PTP1B levels and activities or the already reduced insulin-stimulated glycogen synthesis and tyrosine phosphorylation of IRbeta-subunits and IRS-2 in livers of diabetic rats. RSG treatment in normal rats did not significantly change PTP1B activities and levels or protein levels of IRbeta, IRS-1, and -2 in diabetic rats. These data suggest that RSG enhances insulin activity in skeletal muscle of diabetic rats possibly by ameliorating abnormal levels and activities of PTP1B.
Figures


Similar articles
-
Hypoglycemic effect of Astragalus polysaccharide and its effect on PTP1B.Acta Pharmacol Sin. 2005 Mar;26(3):345-52. doi: 10.1111/j.1745-7254.2005.00062.x. Acta Pharmacol Sin. 2005. PMID: 15715932
-
Rosiglitazone, a PPARγ agonist, ameliorates palmitate-induced insulin resistance and apoptosis in skeletal muscle cells.Cell Biochem Funct. 2014 Dec;32(8):683-91. doi: 10.1002/cbf.3072. Epub 2014 Nov 28. Cell Biochem Funct. 2014. PMID: 25431031
-
Rosiglitazone improves downstream insulin receptor signaling in type 2 diabetic patients.Diabetes. 2003 Aug;52(8):1943-50. doi: 10.2337/diabetes.52.8.1943. Diabetes. 2003. PMID: 12882909 Clinical Trial.
-
Insulin resistance induced by tumor necrosis factor-alpha in myocytes and brown adipocytes.J Anim Sci. 2008 Apr;86(14 Suppl):E94-104. doi: 10.2527/jas.2007-0462. Epub 2007 Oct 16. J Anim Sci. 2008. PMID: 17940160 Review.
-
Pathogenesis of skeletal muscle insulin resistance in type 2 diabetes mellitus.Am J Cardiol. 2002 Sep 5;90(5A):11G-18G. doi: 10.1016/s0002-9149(02)02554-7. Am J Cardiol. 2002. PMID: 12231074 Review.
Cited by
-
Molecular mechanism of angiotensin II-induced insulin resistance in aortic vascular smooth muscle cells: roles of Protein Tyrosine Phosphatase-1B.Vascul Pharmacol. 2010 Sep-Oct;53(3-4):160-8. doi: 10.1016/j.vph.2010.06.001. Epub 2010 Jun 25. Vascul Pharmacol. 2010. PMID: 20601126 Free PMC article.
-
Metabolic syndrome and insulin resistance: underlying causes and modification by exercise training.Compr Physiol. 2013 Jan;3(1):1-58. doi: 10.1002/cphy.c110062. Compr Physiol. 2013. PMID: 23720280 Free PMC article. Review.
-
Skeletal muscle protein tyrosine phosphatase 1B regulates insulin sensitivity in African Americans.Diabetes. 2012 Jun;61(6):1415-22. doi: 10.2337/db11-0744. Epub 2012 Apr 3. Diabetes. 2012. PMID: 22474028 Free PMC article.
-
PPAR-γ2 and PTPRD gene polymorphisms influence type 2 diabetes patients' response to pioglitazone in China.Acta Pharmacol Sin. 2013 Feb;34(2):255-61. doi: 10.1038/aps.2012.144. Epub 2012 Nov 12. Acta Pharmacol Sin. 2013. PMID: 23147557 Free PMC article. Clinical Trial.
-
Improved glucose homeostasis in mice with muscle-specific deletion of protein-tyrosine phosphatase 1B.Mol Cell Biol. 2007 Nov;27(21):7727-34. doi: 10.1128/MCB.00959-07. Epub 2007 Aug 27. Mol Cell Biol. 2007. PMID: 17724080 Free PMC article.
References
-
- AGIUS L., PEAK M., NEWGARD C.B., GOMEZ-FOIX A.M., GUINOVART J.J. Evidence for a role of glucose-induced translocation of glucokinase in the control of hepatic glycogen synthesis. J. Biol. Chem. 1996;271:30479–30486. - PubMed
-
- ALFORD F.P., MARTIN F.I.R., PEARSON M.J. Significance and interpretation of mildly abnormal oral glucose tolerance test. Diabetalogia. 1971;7:173–180. - PubMed
-
- ARONOFF S., ROSENBLATT S., BRAITHWAITE S., EGAN J.W., MATHSEN A., SCHNEIDER R. Pioglitazone hydrochloride monotherapy improves glycemic control in the treatment of patients with type 2 diabetes: a 6-month randomized placebo-controlled dose-response study. The Pioglitazone 001 Study Group. Diabetes Care. 2000;23:1605–1611. - PubMed
Publication types
MeSH terms
Substances
LinkOut - more resources
Full Text Sources
Other Literature Sources
Medical
Miscellaneous

