

doi: 10.1186/gb-2005-6-7-r62.
Epub 2005 Jul 1.
Validation and refinement of gene-regulatory pathways on a network of physical interactions
Affiliations
- PMID: 15998451
- PMCID: PMC1175993
- DOI: 10.1186/gb-2005-6-7-r62
Item in Clipboard
Validation and refinement of gene-regulatory pathways on a network of physical interactions
Genome Biol.
2005.
Abstract
As genome-scale measurements lead to increasingly complex models of gene regulation, systematic approaches are needed to validate and refine these models. Towards this goal, we describe an automated procedure for prioritizing genetic perturbations in order to discriminate optimally between alternative models of a gene-regulatory network. Using this procedure, we evaluate 38 candidate regulatory networks in yeast and perform four high-priority gene knockout experiments. The refined networks support previously unknown regulatory mechanisms downstream of SOK2 and SWI4.
Figures
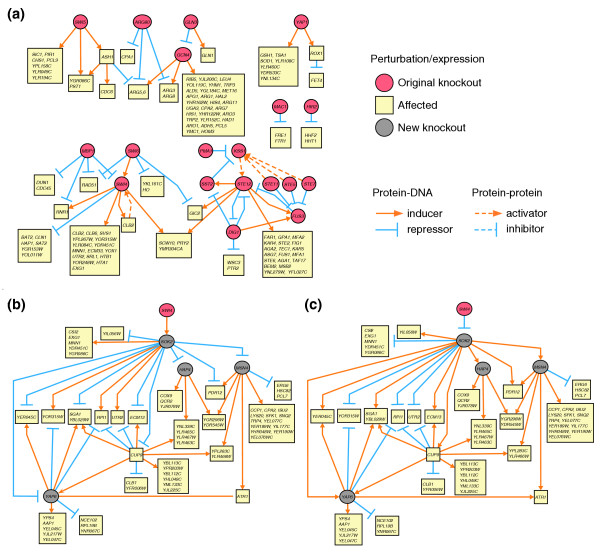
Wiring diagrams for example network models. (a) Model 0, showing regulatory pathways that have unique functional annotations. (b,c) Model 1, showing regulatory pathways downstream of SWI4 and SOK2 with ambiguous functional annotations (several would be consistent with the observed expression responses: two possibilities are shown in (b) and (c), respectively). In the models, a connection from gene a to b represents the experimental observation that the proteins encoded by a and b physically interact in a protein-protein interaction (dotted links), or that the protein encoded by a binds the promoter of b (solid links). Each gene is either defined by an original knockout (red nodes), a differentially expressed effect (yellow nodes), or a signal transducer that was chosen for follow-up perturbation (gray nodes). Functional annotations (edge colors) are uniquely determined in (a) whereas multiple annotations are possible in (b) and (c) based on the available data. Diagram layout is performed automatically using the Cytoscape package [21].
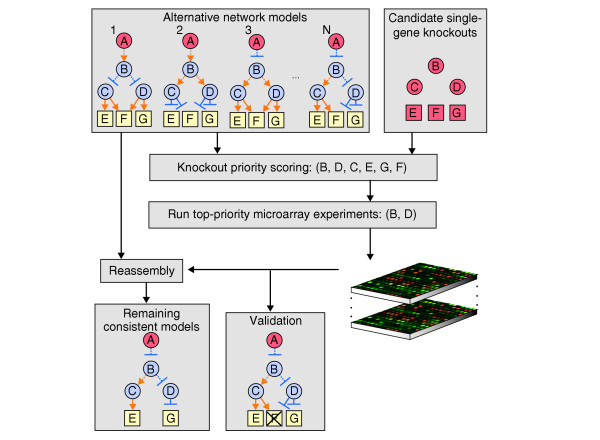
Schematic of the experimental design approach. The input to the approach is a set of alternative representations of a gene-regulatory model, each of which is equally likely given current expression data. In the present work, the alternatives arise as a result of ambiguities in the regulatory roles of interactions in the model as inducers or repressors of downstream genes. Next, a scoring procedure is used to rank candidate perturbations according to their expected information gain over the model alternatives. High-ranking perturbations are applied to the system and characterized using gene-expression microarrays. The resulting expression profiles validate or invalidate particular connections in the model and reduce the set of model alternatives to those that are consistent with both old and new expression measurements.
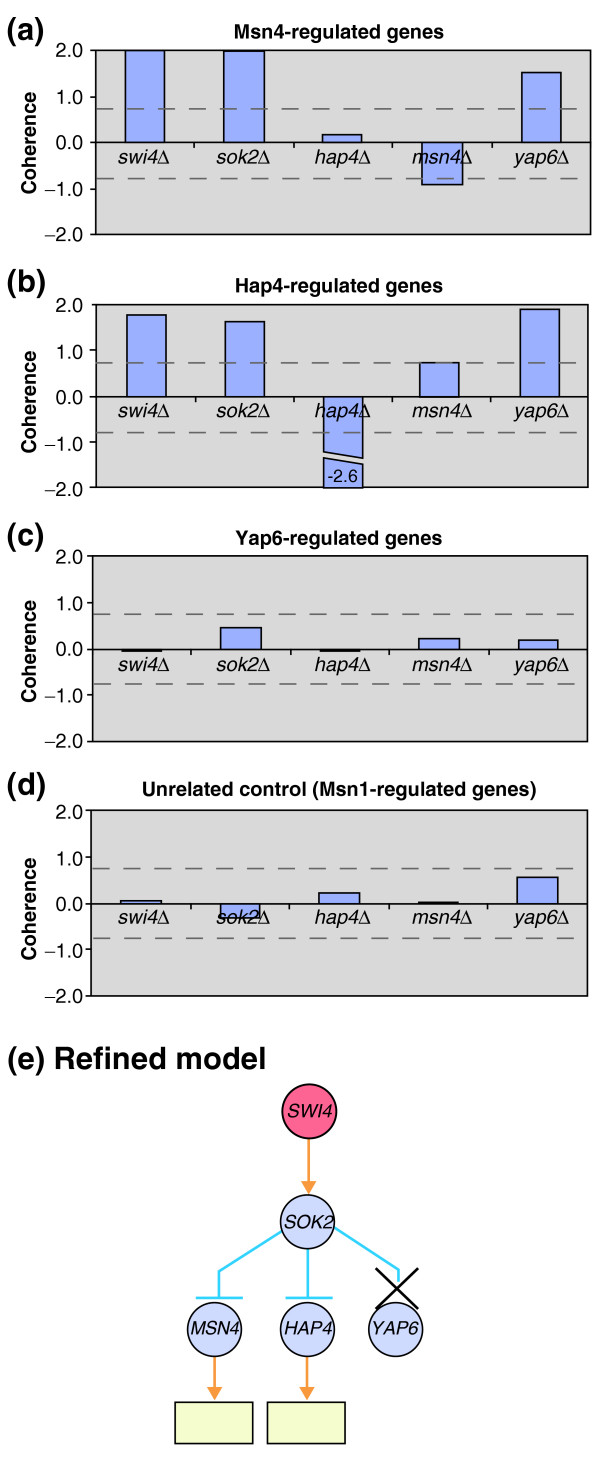
Validation and refinement of Swi4 transcriptional cascades. Yeast genome microarrays were used to explore three transcriptional cascades from Model 1 involving the transcriptional regulators Swi4p, Sok2p, and either (a) Msn4p, (b) Hap4p, or (c) Yap6p. Bar charts show the expression coherence of genes regulated by Msn4p, Hap4p, or Yap6p in knockout strains swi4Δ, sok2Δ, msn4Δ, hap4Δ, and yap6Δ. Coherence scores more extreme than ± 0.7 are significant (p < 0.01, dotted lines). (d) Results are also shown for genes bound by Msn1p as representative of an unrelated model not targeted by these perturbations. This analysis provides validation for the Msn4 and Hap4 pathways and disambiguates the role of each pathway interaction as activating (Swi4 interactions) or repressing (Sok2 interactions) downstream genes (e). The Yap6 pathway hypothesis is not supported by this analysis.

Simulated learning curves of three experimental design methods. Three different methods of selecting experiments are compared: mutual information scores (triangles), hub selection (circles), and random selection (squares). We performed 100 simulated trials and show the average number of ambiguous interactions remaining in the inferred model after each simulated knockout experiment. Vertical bars indicate the standard deviations for the random selection method. The standard deviations for the information and hub selection curves are less than five and are not shown for clarity.
References
Publication types
MeSH terms
Substances
Grants and funding
LinkOut - more resources
Full Text Sources
Other Literature Sources
Molecular Biology Databases
Research Materials
