Comparative Study
. 2005 Jul 12;102(28):9830-5.
doi: 10.1073/pnas.0503401102. Epub 2005 Jul 5.

Annotation of cis-regulatory elements by identification, subclassification, and functional assessment of multispecies conserved sequences

Affiliations
Comparative Study

Annotation of cis-regulatory elements by identification, subclassification, and functional assessment of multispecies conserved sequences

Jim R Hughes et al. Proc Natl Acad Sci U S A. .

Abstract

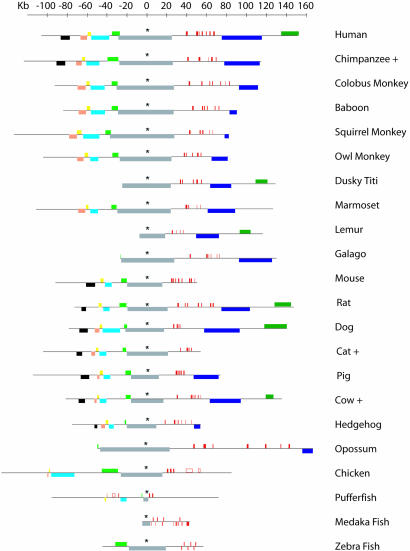
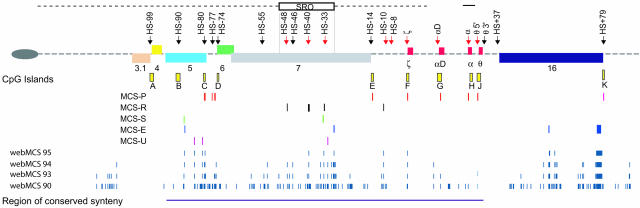
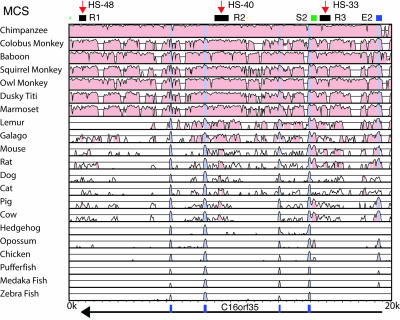
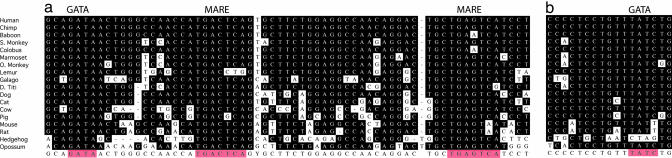
An important step toward improving the annotation of the human genome is to identify cis-acting regulatory elements from primary DNA sequence. One approach is to compare sequences from multiple, divergent species. This approach distinguishes multispecies conserved sequences (MCS) in noncoding regions from more rapidly evolving neutral DNA. Here, we have analyzed a region of approximately 238kb containing the human alpha globin cluster that was sequenced and/or annotated across the syntenic region in 22 species spanning 500 million years of evolution. Using a variety of bioinformatic approaches and correlating the results with many aspects of chromosome structure and function in this region, we were able to identify and evaluate the importance of 24 individual MCSs. This approach sensitively and accurately identified previously characterized regulatory elements but also discovered unidentified promoters, exons, splicing, and transcriptional regulatory elements. Together, these studies demonstrate an integrated approach by which to identify, subclassify, and predict the potential importance of MCSs.


Figures

Fig. 1.
Fig. 1.
The arrangement (to scale) of globin genes (red boxes) and nonglobin genes (colored boxes) flanking the α-globin cluster. The extent of each black horizontal line indicates the amount of DNA sequenced in each species. Further details of these genes are shown in Fig. 2 (see also Fig. 5, which is published as supporting information on the PNAS web site). Sequences of species denoted + were obtained from encode, the rat sequence is from (http://rgd.mcw.edu). The loci are aligned on the highly conserved sixth exon of the C16orf35 gene, which is indicated by an asterisk.
Fig. 2.
Fig. 2.
The prototypical α-globin cluster derived from multispecies comparisons. The telomere represented as an oval. The annotated globin genes (red boxes) and flanking genes (colored boxes) are shown. These genes are annotated as described in ref. : 3.1, POLR3K;4, C16orf33;5, C16orf8;6, MPG;7, C16orf35; and 16, LUC7L. Above the line are DNase1 hypersensitive sites described in the text (black arrows for constitutive and red for erythroid-specific sites). The extentof previously described deletions (black dashed horizontal line) is shown, with a small line over the α gene representing many common deletions (23) that remove these gene(s). The shortest region of overlap (SRO) of all upstream deletions is shown. Below are CpG islands (yellow boxes), conserved promoter elements (MCS-P, red lines), conserved regulatory elements (MCS-R, black lines), conserved splicing intronic regulatory elements (MCS-S, green lines), conserved alternative exons (MCS-E, blue lines), and conserved elements of unknown function (MCS-U, purple lines). In each line, the elements represent MCS-1, MCS-2, MCS-3, MCS-n from left to right. Aligned below the MCSs are the noncoding conservation scores for webmcs analyzed at the 95th, 94th, 93rd, and 90th percentiles. The region of conserved synteny is shown at the bottom as a dark purple line.
Fig. 3.
Fig. 3.
Example of vista output for the 22 species between coordinates 94,273 to 114,273 from the telomere of the human α globin locus. Minimum conservation is 50% in a 100-bp window. Conservation >75% is colored pink, and annotated exons are shaded gray. At the top, shown are three classes of MCS: MCS-R1–3, MCS-S2, and MCS-E2. The position of the erythroid DHSs, HS-48, HS-40 and HS-33, are indicated by red arrows above. The direction of transcription (black arrow) and positions of exons (blue boxes) of the C16orf35 gene are shown below the vista plot.
Fig. 4.
Fig. 4.
Examples of conserved TFBs. The example is from MCS-R2. (a) A fully conserved GATA binding site followed by two conserved Maf recognition elements (MAREs) that form the core of this MCS. (b) A conserved GATA binding site in MCS-R2 that is lost in rodents and hedgehog.

References

    1. Kanehisa, M. & Bork, P. (2003) Nat. Genet. 33 Suppl., 305–310. - PubMed
    1. Thomas, J. W., Touchman, J. W., Blakesley, R. W., Bouffard, G. G., Beckstrom-Sternberg, S. M., Margulies, E. H., Blanchette, M., Siepel, A. C., Thomas, P. J., McDowell, J. C., et al. (2003) Nature 424 788–793. - PubMed
    1. Boffelli, D., Nobrega, M. A. & Rubin, E. M. (2004) Nat. Rev. Genet. 5 456–465. - PubMed
    1. Sidow, A. (2002) Cell 111 13–16. - PubMed
    1. Hardison, R. C. (2000) Trends Genet. 16 369–372. - PubMed

Publication types

LinkOut - more resources