. 2005 Jul 4;202(1):111-21.
doi: 10.1084/jem.20050359.

The timing of TCR alpha expression critically influences T cell development and selection

Affiliations

The timing of TCR alpha expression critically influences T cell development and selection

Troy A Baldwin et al. J Exp Med. .

Abstract

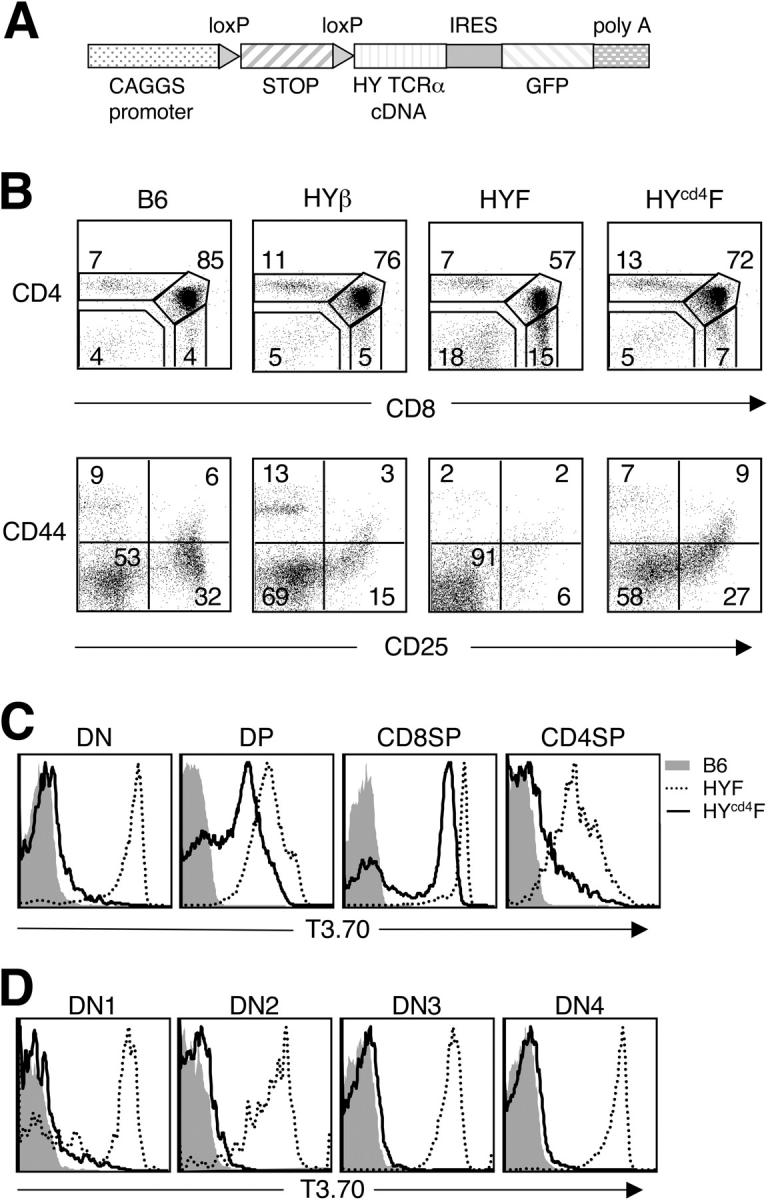
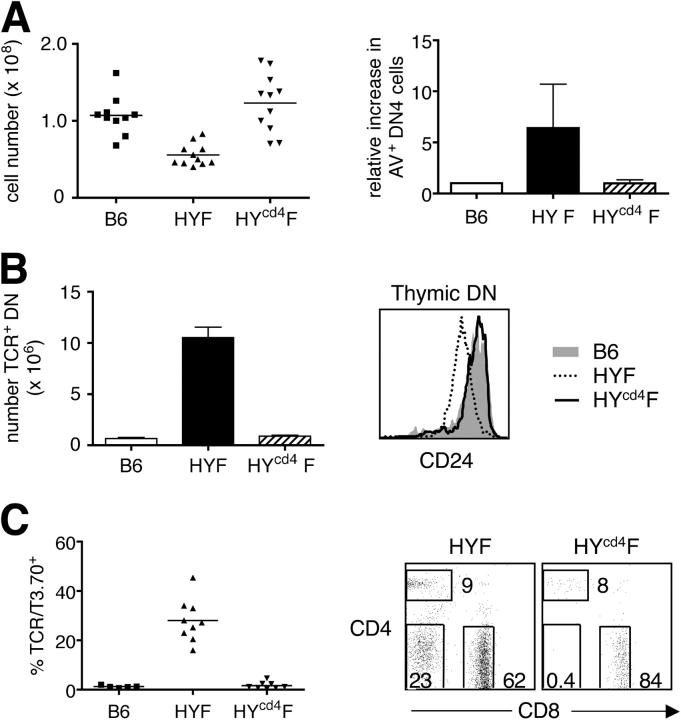
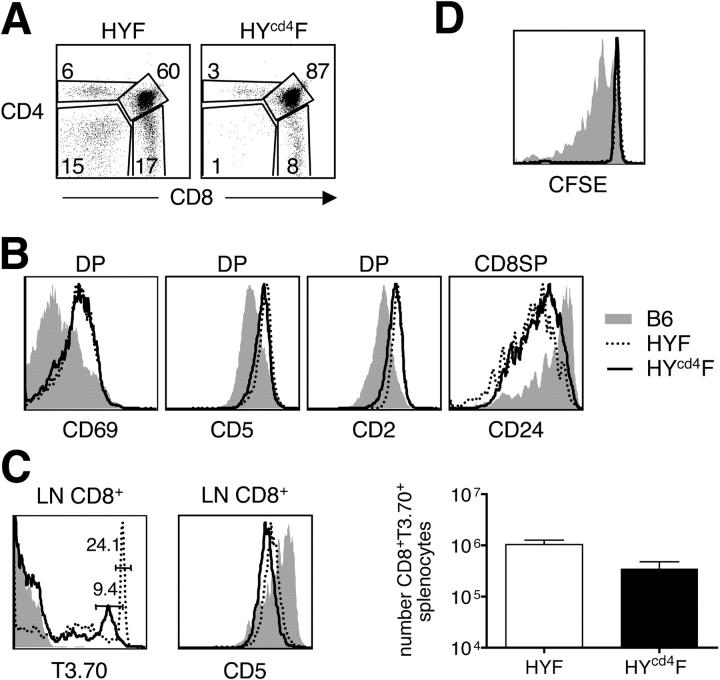
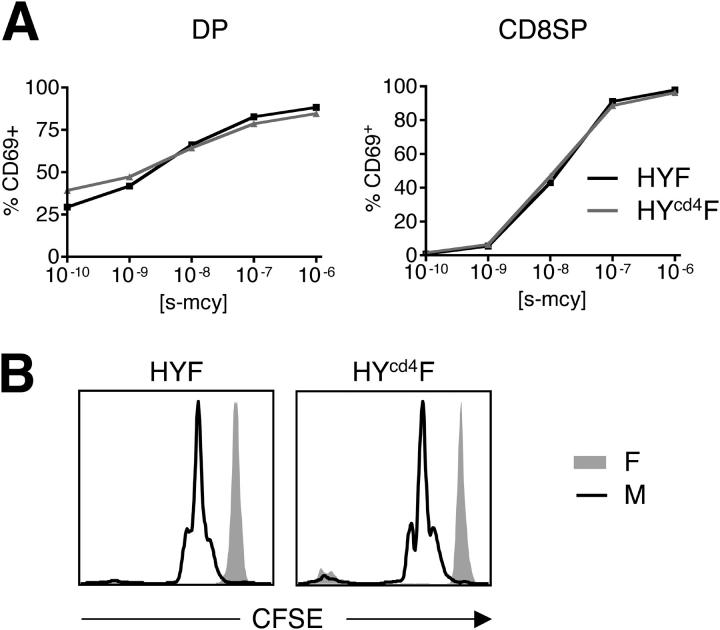
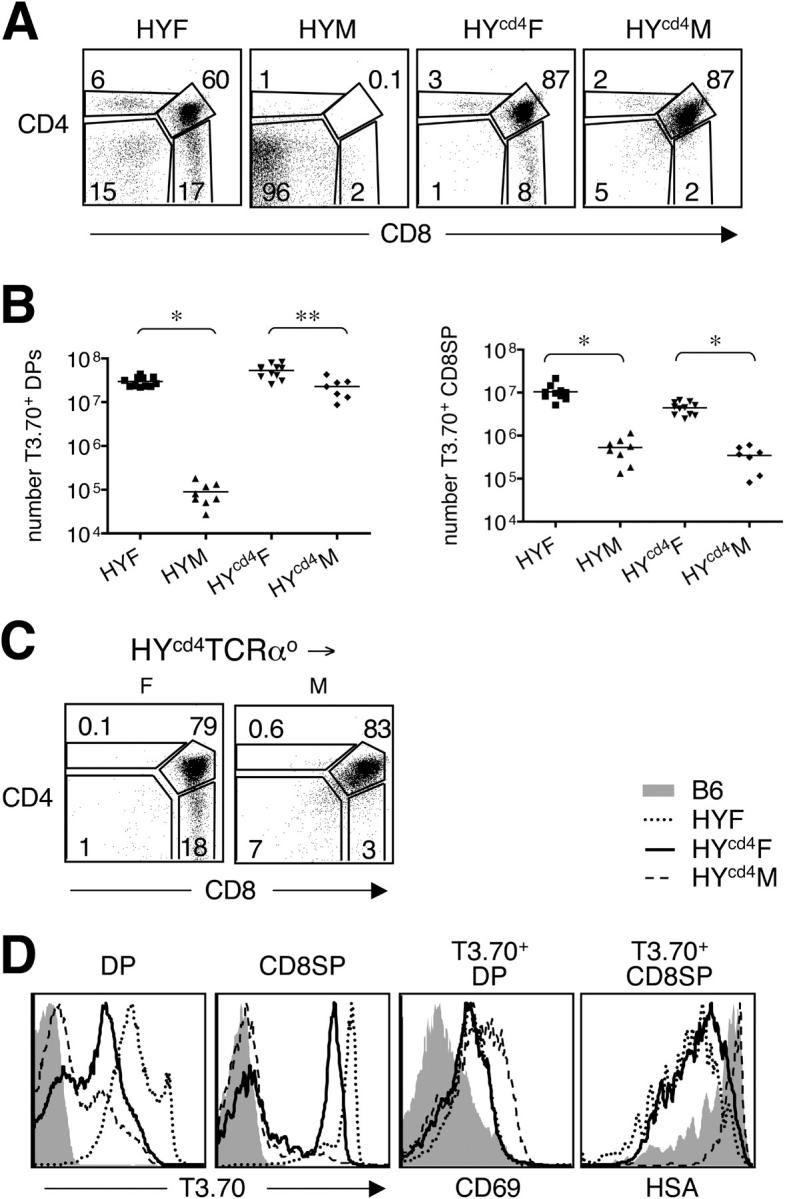
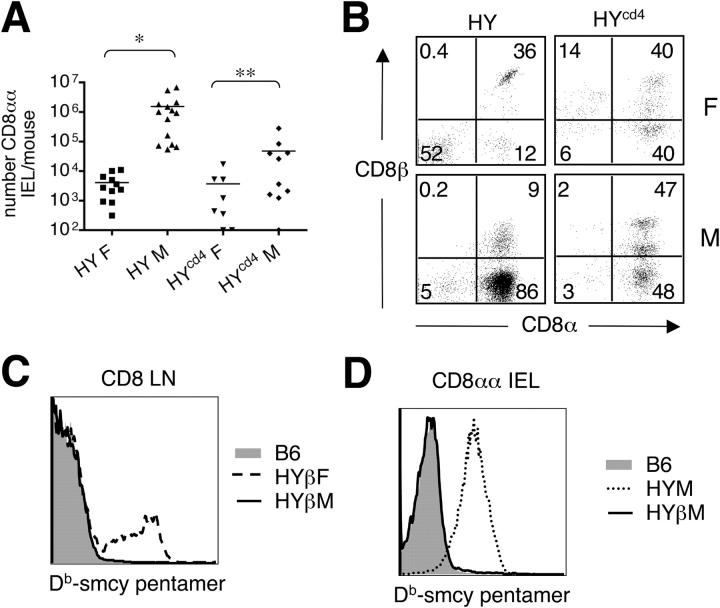
Sequential rearrangement of the T cell receptor for antigen (TCR) beta and alpha chains is a hallmark of thymocyte development. This temporal control is lost in TCR transgenics because the alpha chain is expressed prematurely at the CD4- CD8- double negative (DN) stage. To test the importance of this, we expressed the HY alpha chain at the physiological CD4+ CD8+ double positive (DP) stage. The reduced DP and increased DN cellularity typically seen in TCR transgenics was not observed when the alpha chain was expressed at the appropriate stage. Surprisingly, antigen-driven selection events were also altered. In male mice, thymocyte deletion now occurred at the single positive or medullary stage. In addition, no expansion of CD8 alpha alpha intestinal intraepithelial lymphocytes (IELs) was observed, despite the fact that HY transgenics have been used to model IEL development. Collectively, these data establish the importance of proper timing of TCR expression in thymic development and selection and emphasize the need to use models that most accurately reflect the physiologic process.


Figures

Figure 1.
Figure 1.
Conditional expression of the HY TCR beginning at the DP stage in HYcd4 mice. (A) Schematic representation of the conditional HY TCRα transgene. (B) Thymocytes from the indicated mice were stained with either anti-CD4 and anti-CD8 (top) or with anti-CD4, -CD8, -B220, and –NK1.1 to exclude lineage-positive cells and with anti-CD44 and anti-CD25 (bottom). Cells were analyzed by flow cytometry. Numbers represent the percentage of cells in each gate. (C) Thymocytes from B6 (shaded region), HY female (dotted line), and HYcd4 female (continuous line) were stained with anti-CD4, anti-CD8, and T3.70 and analyzed by flow cytometry. Individual subpopulations were gated, and T3.70 expression is depicted. (D) Thymocytes from B6 (shaded region), HY female (dotted line), and HYcd4 female (continuous line) were stained with anti-CD4, -CD8, -B220, and -NK1.1 to exclude lineage-positive cells and with anti-CD44, anti-CD25, and T3.70 to allow electronic gating of the DN subpopulations. T3.70 expression is depicted for the individual DN subpopulations. The y axes in C and D represent the percentage of maximum expression.
Figure 2.
Figure 2.
β-selection and lineage misdirection is corrected in HYcd4 mice. (A) Total thymocyte numbers from B6 (107 ± 25 × 106), HY female (56 ± 14 × 106), and HYcd4 female (123 ± 38 × 106) are shown (left). Thymocytes were stained with anti-CD4, -CD8, -B220, and -NK1.1 to exclude lineage-positive cells. The horizontal line represents the mean. Anti-CD44, anti-CD25, and annexin V staining were performed to identify apoptotic cells in the DN4 compartment (right). Data are expressed as a ratio of the percentage of annexin V+ DN4 cells compared with B6. Error bar represents SD. (B) DN thymocytes were analyzed for TCRβ or CD24 expression. The number of DN TCR+ cells from B6 (6.7 ± 1.8 × 10⁵), HY female (11 ± 1.7 × 10⁶), and HYcd4 female (9.0 ± 1.8 × 10⁵) (left; error bar represents SD) or the expression level of CD24 on B6 (shaded region), HY female (dotted line), and HYcd4 female (continuous line) (right; y axis represents the percentage of maximum expression) was determined. (C) LN cells from the indicated mice were stained with anti-CD4, anti-CD8, H57-597 (anti-TCRβ), and T3.70. The percentage of CD4CD8 cells expressing T3.70 (HY female and HYcd4 female) or TCRβ (B6) was assessed (left). Additionally, the CD4/CD8 profile of T3.70+ LN cells is shown for HY female and HYcd4 female mice (right). The numbers within the FACS plots represent the percentage of cells within that gate.
Figure 3.
Figure 3.
Positive selection and HP are not affected by early TCRα expression. (A) Thymocytes from HY female and HYcd4 female mice were stained with anti-CD4, anti-CD8, and T3.70 and analyzed by flow cytometry. The CD4/CD8 profile of T3.70+ cells is shown. The numbers within the FACS plots represent the percentage of cells within that gate. (B) T3.70+ DP or CD8SP thymocytes from B6 (shaded region), HY female (dotted line), and HYcd4 female (continuous line) were assessed for levels of CD69, CD5, CD2, and CD24. (C) LN cells from B6 (shaded region), HY female (dotted line), and HYcd4 female (continuous line) mice were stained with anti-CD4, anti-CD8, T3.70, and CD5. The level of T3.70 on gated CD8 cells (left) and CD5 on gated CD8+ T3.70+ cells (middle) is shown. The numbers in the left panel indicate the percentage of T3.70hi CD8 cells. The right panel shows the absolute number of CD8+ T3.70hi splenocytes from HY female (1.0 ± 0.6 × 10⁶) and HYcd4 female (3.5 ± 3 × 10⁵) mice. Error bars represent SD. (D) Bulk thymocytes from HYcd4 female (continuous line) or a mixture of B6 (shaded region) and HY female (dotted line) thymocytes were CFSE labeled and adoptively transferred into sublethally irradiated B6.SJL mice. Recipient mice were harvested 9 d after transfer and CD45.2+ CD8+ T3.70+ cells were analyzed for CFSE dilution. CD45.2+ CD8+ T3.70 cells were used as an internal control. Representative data from one recipient mouse out of three receiving either HYcd4 female or B6/HY female cells are shown. The y axes in B–D represent the percentage of maximum expression.
Figure 4.
Figure 4.
In vitro and in vivo responsiveness of HY and HYcd4 CD8 thymocytes is equivalent. (A) Bulk thymocytes from HY female (black line) or HYcd4 female (gray line) mice were mixed at a 1:1 ratio with female B6 splenocytes and increasing concentrations of agonist smcy peptide were added to the culture and incubated for 20 h. Cells were harvested and stained with anti-CD4, anti-CD8, T3.70, and anti-CD69 and analyzed by flow cytometry. CD4+CD8+T3.70hi (left) and CD4CD8+T3.70+ (right) cells were gated, and the induction of CD69 was measured. Data are expressed as a percentage of cells that maximally up-regulated CD69. (B) HY female (left) or HYcd4 female (right) bulk thymocytes were CFSE labeled and injected i.v. into intact female (shaded region) or male (continuous line) recipients. 48 h after injection, spleens were harvested, and the CFSE dilution of CD8+ T3.70+ cells was measured. The y axis represents the percentage of maximum expression.
Figure 5.
Figure 5.
Deletion occurs late in HYcd4 male mice. (A) Thymocytes from the indicated mice were stained with anti-CD4, anti-CD8, and T3.70 and analyzed by flow cytometry. The T3.70+ thymocytes were gated and the CD4/CD8 profile is indicated. The numbers within the FACS plots represent the percentage of cells falling within that gate. (B) Comparisons of the absolute number of DP (HY female, 30 ± 7.6 × 10⁶; HY male, 9.0 ± 5 × 10⁴; HYcd4 female, 53 ± 18 × 106; HYcd4 male, 23 ± 12 × 106), and CD8SP (HY female, 10 ± 4 × 10⁶; HY male, 5.3 ± 3.3 × 10⁵; HYcd4 female, 4.4 ± 1.4 × 10⁶; HYcd4 male, 3.4 ± 1.9 × 10⁵) T3.70+ thymocytes from the different mouse strains. (*, P < 0.0001; **, P < 0.002). The horizontal lines represent the means. (C) Bone marrow from HYcd4 TCRαo female mice was mixed with either female or male B6.PL bone marrow, and 7 × 10⁶ cells were injected i.v. into lethally irradiated female or male B6.PL recipients, respectively. The female (left) and male (right) recipients were harvested 5–8 wk after transfer. CD4/CD8 profile of Thy1.2+ cells is indicated. (D) DP and CD8SP thymocytes from B6 (shaded region), HY female (dotted line), HYcd4 female (continuous line), and HYcd4 male (dashed line) mice were analyzed by flow cytometry for T3.70 expression (far left and left). T3.70+ DP (right) and T3.70+ CD8SP (far right) were assessed for CD69 up-regulation and CD24 down-regulation, respectively. The y axis represents the percentage of maximum expression.
Figure 6.
Figure 6.
Early TCRα expression is required for expansion of gut CD8αα IELs. (A) IELs were isolated and stained with anti-CD8β, -CD8α, -CD3, and T3.70 and analyzed by flow cytometry. CD3+ T3.70+ cells were electronically gated and the absolute number of CD8αα+ cells was quantified by comparison to the acquisition of a known number of latex beads included in the sample (HY female, 4.1 ± 3.6 × 10³; HY male, 1.5 ± 2.1 × 10⁶; HYcd4 female, 3.7 ± 5.8 × 10³; HYcd4 male, 4.8 ± 8.6 × 10⁴). The horizontal lines represent the means. *, P < 0.05; **, P > 0.05. (B) CD8β/CD8α profile of the CD3+ T3.70+ IELs is shown for the indicated mice. The numbers within the FACS plots represent the percentage of cells falling within that gate. (C) LN cells from B6 (shaded region), HYβ female (dashed line), and HYβ male (continuous line) mice were stained with anti-CD8α, -CD8β, -CD3, and Db–smcy pentamer. Db–smcy pentamer staining for CD3+ CD8αβ+ cells is indicated. (D) IELs were harvested from B6 (shaded region), HYβ male (continuous line), and HY male (dotted line) mice and stained with anti-CD8α, -CD8β, -CD3, and Db–smcy pentamers. Db–smcy pentamer staining from CD3+ CD8αα+ cells is indicated. The y axes in C and D represent the percentage of maximum expression.

References

    1. Starr, T.K., S.C. Jameson, and K.A. Hogquist. 2003. Positive and negative selection of T cells. Annu. Rev. Immunol. 21:139–176. - PubMed
    1. Trop, S., M. Rhodes, D.L. Wiest, P. Hugo, and J.C. Zuniga-Pflucker. 2000. Competitive displacement of pT alpha by TCR-alpha during TCR assembly prevents surface coexpression of pre-TCR and alpha beta TCR. J. Immunol. 165:5566–5572. - PubMed
    1. Borowski, C., X. Li, I. Aifantis, F. Gounari, and H. von Boehmer. 2004. Pre-TCRα and TCRα are not interchangeable partners of TCRβ during T lymphocyte development. J. Exp. Med. 199:607–615. - PMC - PubMed
    1. Bruno, L., H.J. Fehling, and H. von Boehmer. 1996. The alpha beta T cell receptor can replace the gamma delta receptor in the development of gamma delta lineage cells. Immunity. 5:343–352. - PubMed
    1. Fritsch, M., A. Andersson, K. Petersson, and F. Ivars. 1998. A TCR alpha chain transgene induces maturation of CD4- CD8- alpha beta+ T cells from gamma delta T cell precursors. Eur. J. Immunol. 28:828–837. - PubMed

Publication types

MeSH terms

Substances