

An atlas of human gene expression from massively parallel signature sequencing (MPSS)
- PMID: 15998913
- PMCID: PMC1172045
- DOI: 10.1101/gr.4041005
An atlas of human gene expression from massively parallel signature sequencing (MPSS)
Abstract
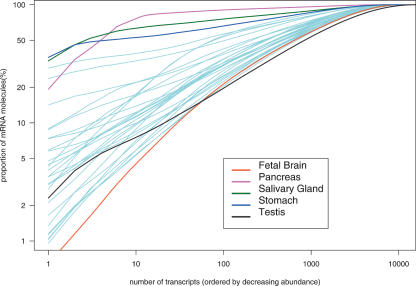
We have used massively parallel signature sequencing (MPSS) to sample the transcriptomes of 32 normal human tissues to an unprecedented depth, thus documenting the patterns of expression of almost 20,000 genes with high sensitivity and specificity. The data confirm the widely held belief that differences in gene expression between cell and tissue types are largely determined by transcripts derived from a limited number of tissue-specific genes, rather than by combinations of more promiscuously expressed genes. Expression of a little more than half of all known human genes seems to account for both the common requirements and the specific functions of the tissues sampled. A classification of tissues based on patterns of gene expression largely reproduces classifications based on anatomical and biochemical properties. The unbiased sampling of the human transcriptome achieved by MPSS supports the idea that most human genes have been mapped, if not functionally characterized. This data set should prove useful for the identification of tissue-specific genes, for the study of global changes induced by pathological conditions, and for the definition of a minimal set of genes necessary for basic cell maintenance. The data are available on the Web at http://mpss.licr.org and http://sgb.lynxgen.com.
Figures


References
-
- Brenner, S., Johnson, M., Bridgham, J., Golda, G., Lloyd, D.H., Johnson, D., Luo, S., McCurdy, S., Foy, M., Ewan, M., et al. 2000a. Gene expression analysis by massively parallel signature sequencing (MPSS) on microbead arrays. Nat. Biotechnol. 18: 630-634. - PubMed
-
- Brenner, S., Williams, S.R., Vermaas, E.H., Storck, T., Moon, K., McCollum, C., Mao, J.I., Luo, S., Kirchner, J.J., Eletr, S., et al. 2000b. In vitro cloning of complex mixtures of DNA on microbeads: Physical separation of differentially expressed cDNAs. Proc. Natl. Acad. Sci. 97: 1665-1670. - PMC - PubMed
-
- Hsiao, L.L., Dangond, F., Yoshida, T., Hong, R., Jensen, R.V., Misra, J., Dillon, W., Lee, K.F., Clark, K.E., Haverty, P., et al. 2001. A compendium of gene expression in normal human tissues. Physiol. Genomics 7: 97-104. - PubMed
Web site references
-
- http://expression.gnf.org; Gene Expression Atlas.
-
- http://genecards.weizmann.ac.il/genenote; GeneNote.
-
- http://mpss.licr.org and http://sgb.lynxgen.com; MPSS atlas of human gene expression (this paper).
-
- http://symatlas.gnf.org; SymAtlas.
Publication types
MeSH terms
Substances
LinkOut - more resources
Full Text Sources
Other Literature Sources
Molecular Biology Databases