. 2005 Oct 1;568(Pt 1):267-81.
doi: 10.1113/jphysiol.2005.090233. Epub 2005 Jul 7.

Defining electrical communication in skeletal muscle resistance arteries: a computational approach

Affiliations

Defining electrical communication in skeletal muscle resistance arteries: a computational approach

Hai K Diep et al. J Physiol. .

Abstract

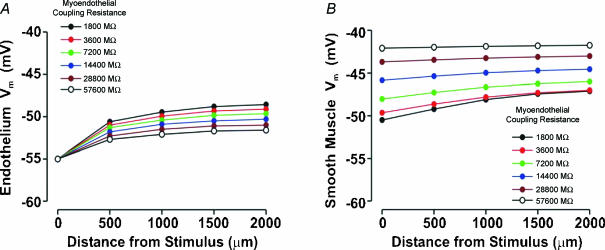
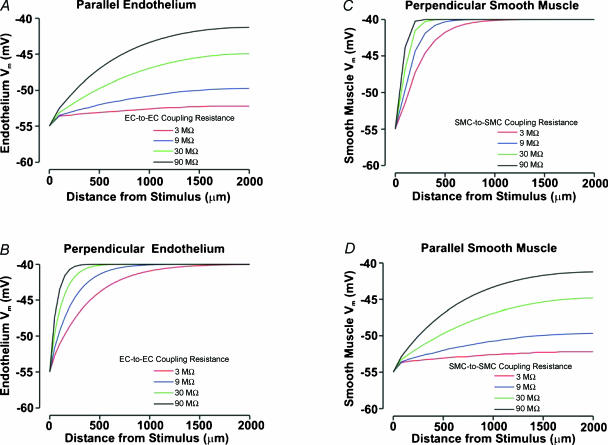
Vascular cells communicate electrically to coordinate their activity and control tissue blood flow. To foster a quantitative understanding of this fundamental process, we developed a computational model that was structured to mimic a skeletal muscle resistance artery. Each endothelial cell and smooth muscle cell in our virtual artery was treated as the electrical equivalent of a capacitor coupled in parallel with a non-linear resistor representing ionic conductance; intercellular gap junctions were represented by ohmic resistors. Simulations revealed that the vessel wall is not a syncytium in which electrical stimuli spread equally to all constitutive cells. Indeed, electrical signals spread in a differential manner among and between endothelial cells and smooth muscle cells according to the initial stimulus. The predictions of our model agree with physiological data from the feed artery of the hamster retractor muscle. Cell orientation and coupling resistance were the principal factors that enable electrical signals to spread differentially along and between the two cell types. Our computational observations also illustrated how gap junctional coupling enables the vessel wall to filter and transform transient electrical events into sustained voltage responses. Functionally, differential electrical communication would permit discrete regions of smooth muscle activity to locally regulate blood flow and the endothelium to coordinate regional changes in tissue perfusion.


Figures

Figure 1
Figure 1. Physical and electrical representation of the virtual resistance artery
A, the virtual artery was 2.2 mm long and comprised of one layer of endothelium (red) and one layer of smooth muscle (black). Each arterial segment (n = 44) consisted of 48 endothelial cells and 30 smooth muscle cells. Cells were treated as discrete elements with defined physical dimensions, gap junctional coupling and ionic conductance. Neighbouring smooth muscle cells were electrically coupled to one another as were neighbouring endothelial cells. Every smooth muscle cell was randomly coupled to two endothelial cells (red dot denotes myoendothelial contact site). B, equivalent circuit representation of the virtual artery. Each cell was modelled as a capacitor coupled in parallel with a non-linear resistor representing ionic conductance of the plasma membrane; gap junctions were represent by ohmic resistors. The I–V properties of the non-linear resistors are displayed in the bottom panel referenced to a resting Vm of −40 mV.
Figure 2
Figure 2. Endothelium-initiated responses conduct robustly along resistance arteries
Simulations: endothelial cells within one arterial segment were voltage clamped (red band denoted by arrowhead; corresponding to distance = 0) 15 mV negative or positive to resting Vm (− 40 mV) for 250 ms (A–C) or 5000 ms (D). Electrical and vasomotor responses were monitored at and remote from the site of endothelial cell stimulation. A and B, the predicted electrical response of endothelial and smooth muscle cells to a hyperpolarizing voltage step as colour-mapped along the vessel wall and represented in 2-D voltage plots, respectively. C, the predicted electrical response (at 250 ms) of respective cells to a depolarizing or hyperpolarizing voltage step. D, the predicted vasodilator response (at 5000 ms) to a hyperpolarizing voltage step. E, experimental observations (Emerson & Segal, 2000a): endothelial cells in a small region of a hamster retractor muscle feed artery were stimulated with acetylcholine via microiontophoresis while the electrical and vasomotor responses were monitored at sites close to or remote from the site of stimulation. Data in C and D from Emerson & Segal 2000b, used with permission from Lippincott Williams & Wilkins © 2000.
Figure 3
Figure 3. Effect of myoendothelial coupling resistance on endothelial-initiated conduction
Simulations: endothelial cells within one arterial segment were voltage clamped 15 mV negative to resting Vm (−40 mV) for 250 ms. Electrical responses were monitored at and remote from the site of endothelial cell stimulation; myoendothelial coupling resistance was varied between 1800 and 57 600 MΩ. A and B, the predicted electrical response (at 250 ms) of endothelial and smooth muscle cells to the hyperpolarizing voltage step. Data used with permission from Kurjiaka et al. 2005.
Figure 4
Figure 4. Smooth muscle-initiated responses conduct poorly along resistance arteries
Simulations: smooth muscle cells within one arterial segment were voltage clamped (red band denoted by arrowhead; corresponding to distance = 0) 15 mV positive or negative to resting Vm (−40 mV) for 250 ms (A–C) or 5000 ms (D). Electrical and vasomotor responses were monitored at and remote from the site of smooth muscle stimulation. A and B, the predicted electrical response of endothelial and smooth muscle cells to a depolarizing voltage step as colour-mapped along the vessel wall and represented in 2-D voltage plots, respectively. C, the predicted electrical response (at 250 ms) of vascular cells to a depolarizing or hyperpolarizing voltage step. D, the predicted vasoconstrictor response (at 5000 ms) to a depolarizing voltage step. E, experimental observations (Kurjiaka et al. 2005). Smooth muscle cells in a small region of a retractor muscle feed artery were stimulated via micropipette with phenylephrine or KCl while diameter was monitored at sites close to or remote from the site of stimulation. Data in B and C from Emerson & Segal 2000b, used with permission from Lippincott Williams & Wilkins © 2000.
Figure 5
Figure 5. Driving endothelial cell Vm by increasing the number of stimulated smooth muscle cells
Simulations: 1, 5, 10, 20 and 40 arterial segments of smooth muscle were voltage clamped 15 mV positive to resting Vm (−40 mV) for 250 ms. Voltage responses were monitored along the vessel wall. A, the predicted electrical response of endothelial and smooth muscle cells to a depolarizing voltage step as colour-mapped along the vessel wall. Arrowhead denotes ‘first segment of stimulated smooth muscle’. B, the predicted voltage (at 250 ms) of endothelial cells to a depolarizing voltage step as monitored every 500 μm from the first segment of stimulated smooth muscle. C, experimental observations ((1) Emerson & Segal, 2000a; (2) Emerson & Segal, 2000b; (3) Emerson et al. 2002): isolated hamster retractor muscle feed arteries were pressurized to 75 mmHg to mechanically stimulate the smooth muscle cell layer to depolarize. Membrane potential was recorded in endothelial cells and in smooth muscle cells. Data in B and C from Emerson & Segal 2000b, used with permission from Lippincott Williams & Wilkins © 2000.
Figure 6
Figure 6. Effects of coupling resistance and cell orientation on endothelium or smooth muscle conduction
Simulations in A and C: endothelial cells (EC) and smooth muscle cells (SMC) were orientated parallel and perpendicular to the virtual artery's longitudinal axis, respectively. In the absence of myoendothelial coupling (induced by increasing coupling resistance to 200 000 MΩ), a 50 μm segment of endothelium (A) or smooth muscle (C) was voltage-clamped 15 mV negative to resting Vm (−40 mV) for 250 ms. Endothelium (A) or smooth muscle (C) Vm (at 250 ms) was monitored at and remote from the site of stimulation. Simulations in B and D: ECs and SMCs were reoriented perpendicular and parallel to the virtual artery's longitudinal axis, respectively. In the absence of myoendothelial coupling, a 50 μm segment of endothelium (B) or an 80 μm segment of smooth muscle (D) was voltage-clamped 15 mV negative to resting Vm (−40 mV) for 250 ms. Endothelium (B) or smooth muscle (D) Vm (at 250 ms) was monitored at and remote from the site of stimulation.
Figure 7
Figure 7. Endothelial cell disruption eliminates conduction
Simulations: endothelial cells within one arterial segment were voltage clamped (red band denoted by arrowhead) 15 mV negative to resting Vm (−40 mV) for 250 ms (A and B) or 5000 ms (C). Electrical and vasomotor responses were monitored every 500 μm from the site of endothelial cell stimulation under resting conditions and following the disruption of endothelial cell communication in 4 consecutive arterial segments along the conduction pathway (denoted by rectangle). A and B, the predicted electrical response of endothelial and smooth muscle cells as colour-mapped along the vessel wall and presented in 2-D voltage plots (at 250 ms), respectively. C, the predicted vasodilator response (at 5000 ms) prior to and following endothelial cell disruption. D and E, experimental observations (Emerson & Segal, 2000a): endothelial cells within a small region of a retractor muscle feed artery were stimulated with acetylcholine and responses monitored close to or remote from the site of application. Membrane potential and vasomotor responses were recorded prior to and following the use of light dye treatment to disrupt endothelial cell communication within the region of the feed artery denoted by rectangle.
Figure 8
Figure 8. Smooth muscle cell disruption has no effect on conduction
Simulations: endothelial cells within one arterial segment (red band denoted by arrowhead) were voltage clamped 15 mV negative to resting Vm (−40 mV) for 250 ms (A and B) or 5000 ms (C). Electrical and vasomotor responses were monitored every 500 μm from site of endothelial cell stimulation under resting conditions and following the disruption of muscle cell communication in 4 consecutive arterial segments along the conduction pathway (denoted by the rectangle). A and B, the predicted electrical response of endothelial and smooth muscle cells as colour-mapped along the vessel wall and presented in 2-D voltage plots (at 250 ms), respectively. C, the predicted vasodilator response (at 5000 ms) prior to and following smooth muscle cell disruption. D and E, experimental observations (Emerson & Segal, 2000a): endothelial cells within a small region of a retractor muscle feed artery were stimulated with acetylcholine and responses monitored close to or remote from the site of stimulation. Membrane potential and vasomotor responses were recorded prior to and following the use of light dye treatment to disrupt smooth muscle cell communication within the region of the feed artery denoted by rectangle.
Figure 9
Figure 9. Transforming spontaneous transient outward currents (STOCs) into sustained hyperpolarization
Simulations: smooth muscle cells (SMCs) in the virtual artery were programmed to randomly generate 2 STOCs per second. The electrical response of the SMC layer was monitored under control conditions and following the elimination of myoendothelial and/or SMC-to-SMC coupling (induced by increasing the respective coupling resistance to 200 000 MΩ). A, the predicted voltage response of the SMC layer as colour-mapped in the middle portion of the virtual artery under respective conditions. Arrowheads denote individual SMCs. B, the predicted voltage response of 5 smooth muscle cells from the middle portion of the virtual artery plotted over time under respective conditions.

References

    1. Bartlett IS, Segal SS. Resolution of smooth muscle and endothelial pathways for conduction along hamster cheek pouch arterioles. Am J Physiol. 2000;278:H604–H612. - PubMed
    1. Crane GJ, Hines ML, Neild TO. Simulating the spread of membrane potential changes in arteriolar networks. Microcirculation. 2001;8:33–43. - PubMed
    1. de Wit C, Roos F, Bolz SS, Kirchhoff S, Kruger O, Willecke K, Pohl U. Impaired conduction of vasodilation along arterioles in connexin40-deficient mice. Circ Res. 2000;86:649–655. - PubMed
    1. Emerson GG, Neild TO, Segal SS. Conduction of hyperpolarization along hamster feed arteries: augmentation by acetylcholine. Am J Physiol. 2002;283:H102–H109. - PubMed
    1. Emerson GG, Segal SS. Endothelial cell pathway for conduction of hyperpolarization and vasodilation along hamster feed artery. Circ Res. 2000a;86:94–100. - PubMed

Publication types

LinkOut - more resources