. 2005 Sep 15;567(Pt 3):851-67.
doi: 10.1113/jphysiol.2005.089771. Epub 2005 Jul 7.

Protein kinase C mediates up-regulation of tetrodotoxin-resistant, persistent Na+ current in rat and mouse sensory neurones

Affiliations

Protein kinase C mediates up-regulation of tetrodotoxin-resistant, persistent Na+ current in rat and mouse sensory neurones

Mark D Baker. J Physiol. .

Abstract

The tetrodotoxin-resistant (TTX-r) persistent Na(+) current, attributed to Na(V)1.9, was recorded in small (< 25 mum apparent diameter) dorsal root ganglion (DRG) neurones cultured from P21 rats and from adult wild-type and Na(V)1.8 null mice. In conventional whole-cell recordings intracellular GTP-gamma-S caused current up-regulation, an effect inhibited by the PKC pseudosubstrate inhibitor, PKC19-36. The current amplitude was also up-regulated by 25 microM intracellular 1-oleoyl-2-acetyl-sn-glycerol (OAG) consistent with PKC involvement. In perforated-patch recordings, phorbol 12-myristate 13-acetate (PMA) up-regulated the current, whereas membrane-permeant activators of protein kinase A (PKA) were without effect. PGE(2) did not acutely up-regulate the current. Conversely, both PGE(2) and PKA activation up-regulated the major TTX-r Na(+) current, Na(V)1.8. Extracellular ATP up-regulated the persistent current with an average apparent K(d) near 13 microM, possibly consistent with P2Y receptor activation. Numerical simulation of the up-regulation qualitatively reproduced changes in sensory neurone firing properties. The activation of PKC appears to be a necessary step in the GTP-dependent up-regulation of persistent Na(+) current.


Figures

Figure 1
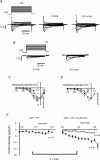
Figure 1. Kinase inhibition blocks the up-regulation of persistent Na+ current
A, recording of TTX-r Na+ currents, made immediately after attaining the whole-cell configuration in a wild-type (WT) neurone, which includes a low-threshold persistent portion. Heavy trace indicates current activated by a step to −30 mV. An interpretation of the currents evoked by depolarization (right) indicates that the current at −30 mV and more negative is largely persistent Na+ current. B, Na+ currents recorded in WT neurones in response to voltage-clamp steps to −30 mV. Dramatic up-regulation of the current amplitude followed the introduction of 500 μm GTP-γ-S to the neurone interior (by over 6 times within 5 min, same neurone as in A). After pre-exposure to 20 μm H7 in another neurone with a very similar initial current, up-regulation was near 150%. C, in NaV1.8 null neurones, an intracellular solution containing GTP-γ-S and ATP (filled bars) gave rise to a substantial up-regulation of peak persistent current (I, measured at −10 mV or −20 mV, whichever was the larger) at 2 and 4.5 min (n = 10 and 8, respectively), in comparison to the initial current amplitude (I0). The addition of 500 nm to 5 μm PKC19–36 to the intracellular solution with GTP-γ-S and ATP (open bars), blocked the up-regulation at 2 and 4.5 min (n = 6 and 4, respectively), consistent with a role for PKC. (*P < 0.05, **P < 0.01, one-tailed, unpaired t test.)
Figure 2
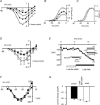
Figure 2. OAG in the pipette solution with GDP + ATP causes persistent Na+ current up-regulation in WT neurones
A, families of TTX-r Na+ currents evoked by the inset voltage-clamp protocol. At −40 mV, a potential more negative than the activation threshold for NaV1.8, a persistent current was up-regulated over 5.5 min (dark traces). B, subtraction of initially recorded currents from those recorded later gives the component that was up-regulated, corresponding with persistent Na+ current. C, I−V plots for peak Na+ current at the start of recording (•), 2 min (○), 5.5 min (▴) and 7.5 min (▵) into the voltage-clamp. D, I−V plots for initial peak Na+ current (•), and for that component up-regulated at 5.5 min (▴) and 7.5 min (▵). E, no up-regulation of current at −40 mV with GDP + ATP was apparent in 9 neurones (left hand panel), whereas 5 of 9 neurones with 25 μm internal OAG exhibited an up-regulation at −40 mV (right hand panel; P < 0.03, Fisher's exact test). In E those neurones showing no clear up-regulation in the right-hand panel (○) are presumably without functional persistent Na+ current.
Figure 3
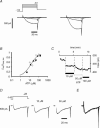
Figure 3. PMA up-regulates persistent Na+ current, whereas membrane permeant activators of PKA do not
A, peak current–membrane potential relation for persistent Na+ current in NaV1.8 null neurone before (•) and during exposure to 100 μm PMA for up to 5 min (○), 15 min (▴) and 25 min (▵). Any change in apparent reversal potential on exposure to PMA is caused by the up-regulation of persistent Na+ current recorded against residual K+ currents, and it does not represent a true change in reversal potential for Na+. B, current amplitude values at 5, 15 and 25 min in A were converted to conductances, assuming ENa to be +60 mV, normalized to the maximal conductance at 5 min, and plotted against membrane potential. The maximal conductance doubled between 5 and 25 min. C, normalized conductance values for 5 and 25 min, superimposed on Boltzmann relations, drawn with best-fit parameters, and giving half-maximal activation potentials of −32.6 and −38.3 mV, respectively. D, 100 μm PMA caused up-regulation of persistent Na+ current in NaV1.8 null neurones (n = 5) where data were obtained following an exposure lasting close to 5 min. Data normalized to maximal pre-exposure inward current for each neurone. E, exposure of a WT neurone to 1 mm db-cAMP does not up-regulate current amplitude at −40 mV, but 1 μm PMA causes an immediate and profound up-regulation (n = 2 where both agents were applied). F, I−V relation for persistent Na+ current in an NaV1.8 null neurone before, during and after (•, ○, ▵, respectively) exposure to 1 mm 8Br-cAMP for 2.5 min. Similar recordings with 500 μm 8Br-cAMP for up to 3 min were also without effect (total n = 3). G, peak TTX-r inward current densities in WT neurones, measured at −40 mV, before, following several minutes exposure to 1 mm 8Br-cAMP, and during wash (n = 3). The PKA activator does not appear to up-regulate persistent Na+ current. All recordings made using perforated patches.
Figure 4
Figure 4. PMA exposure causes a small up-regulation in NaV1.8 amplitude
A and C, representative Na+ currents attributable to NaV1.8 in WT neurones, and B and D, mean I−V relation (for 3 and 4 neurones, respectively) before and during superfusion of PMA at 1 μm (A) or 100 nm (C) over minutes (largest current amplitude values in both conditions before (•) and during (○) exposure, respectively). The values are normalized with respect to the maximal peak pre-exposure values. Larger increase in amplitude obtained with 100 nm PMA is a small but statistically significant change (P= 0.004, repeated measures, 2-way ANOVA), with the largest individual peak increase being close to 24%. E and F, superfusion of 1 mm 8Br-cAMP up-regulates NaV1.8 in an example neurone. The peak current at 0 mV increased by 46% in minutes. F, I−V plots, for the same neurone in E, before (•), during exposure (○) and during washing (▵). All recordings made using perforated patches and data points are not corrected for residual series-resistance errors.
Figure 5
Figure 5. PGE2 exposure and activation of PKA acutely up-regulates NaV1.8
A, superfusion of 5 μm PGE2 caused an up-regulation of NaV1.8 amplitude, recorded at +10 mV. Similar results were obtained in 6 neurones. B, peak current-voltage relations for the same neurone in A, recorded before (•) and after (○) exposure to PGE2 (i.e. immediately before and after making the recordings for A). C, plot of normalized peak conductance values against membrane potential, derived from the current values in B, before (•) and after (○) exposure to PGE2. Smooth curves are Boltzmann relations with maximal amplitudes of 1 and 1.62, and half-maximal activation potentials of −13.34 and −17.82 mV before and after exposure to PGE2, respectively. Conductances were derived assuming ENa to be +60 mV. D, normalized peak conductance versus membrane potential plot, before and during exposure to 8Br-cAMP (1 mm); same cell as in Fig. 4E and F. Smooth curves are Boltzmann relations with maximal amplitudes of 1 and 1.3 and half-maximal activation potentials of −4.98 and −11.32 mV before and after exposure to 8Br-cAMP. ENa was assumed to be +62 mV. Data points were not corrected for residual series-resistance errors. All recordings made using perforated patches.
Figure 6
Figure 6. Negative shift in voltage threshold and the simultaneous up-regulation of a low-threshold inward current
A, current-clamp (perforated-patch) recordings in control solution and at 10 min following exposure to 1 μm external PMA in a WT neurone (left and right hand panels, respectively). Neurone held near −80 mV, before step depolarizations. Smooth lines are exponentials drawn according to best-fit parameters, whose trajectory approximates the passive membrane response to depolarization. An increase in excitability results in a negative shift in voltage threshold, from −43 to −52 mV (indicated by arrows), and an increase in the latency of the action potential generated by a near threshold depolarization. The estimated voltage-threshold in the control recording is indicated on the action potential in the right hand panel as a short line. B, voltage-clamp recordings from the same neurone as in A. Under control conditions, no low-threshold inward current was observed (left-hand panel). After exposure to PMA, a persistent inward current contributes at negative potentials (change in current is plotted, right-hand panel). With a voltage-clamp step to −50 mV, inadequacies in the voltage-clamp prevented control of the Na+ current and the current became regenerative (arrow).
Figure 7
Figure 7. Persistent Na+ current is up-regulated by exposure to external ATP
A, TTX-r inward currents recorded at negative potentials in a WT neurone were up-regulated within a minute following exposure to a bolus of ATP introduced into the recording chamber (final concentration 50 μm). Left hand panel, and right hand panel before and after ATP introduction, respectively. B, increment in current amplitude (Iinc) on exposure to ATP (continuous superfusion) plotted as a fraction of maximum increase possible (Imax inc) in each neurone. The maximum increase for each neurone was found by fitting an isotherm to the raw amplitude values. Each symbol type represents an individual neurone. ○, ▴, ▵ indicate peak current values from NaV1.8 null neurones and, ▪ from WT (in the latter the current amplitude was measured at −40 mV). Smooth curve is a Langmuir isotherm drawn according to parameters providing the best-fit to all data points, with an apparent Kd= 13 μm. C, example increases in Na+ current amplitude on exposure to increasing concentrations of ATP in an NaV1.8 null neurone (exposure time indicated by the bars beneath the data points). D, increase in Na+ current amplitude measured at −28 mV, before and after exposure to 10 and 50 μm ATP in an NaV1.8 null neurone (same as that in panel C). E, scaled version of control current in D (thin line), superimposed on current recorded in the presence of 50 μm ATP (thick line). No obvious changes in current kinetics occurred as the current amplitude increased, consistent with unchanged gating voltage dependence.
Figure 8
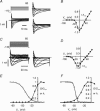
Figure 8. Characteristics of Na+ currents incorporated into numerical simulation
A, left panel, typical example NaV1.8 currents recorded in the presence of TTX and simulated currents (right panel). Simulated Na+ currents without and with residual fast K+ current (upper and lower family of voltage-clamp traces, respectively). B, the corresponding peak I−V plot for simulated currents (without K+currents) using a one-third physiological Na+ gradient. C, example persistent Na+ currents recorded in NaV1.8 null in the presence of TTX, and simulated currents. Real currents show some residual delayed rectification that remains following exposure to K+ channel blockers. D, corresponding peak I−V plot for simulated currents. E, G/Gmax (activation, •) and h (inactivation, ○) curve for simulated NaV1.8. The values of h were calculated directly from rate constants, whereas the activation curve was obtained by measuring the peak currents generated in a voltage-clamp protocol with a negative holding potential, and converting them to conductances. F, activation and inactivation curves for persistent Na+ current, G/Gmax (•) and h (▴). The effect of inactivation rate on peak conductance can be observed at potentials more positive than −10 mV. The effects of ultra-slow inactivation on persistent Na+ current were not included in the simulation.
Figure 9
Figure 9. Simulated neurone exhibits characteristic changes in firing properties on up-regulation of persistent Na+ current
A, just sub- and just supra-threshold responses from a control simulated neurone, lacking persistent Na+ current, being held at −90 mV (left hand panel). The action potential was evoked within the 10 ms stimulus duration. Just sub- and just supra-threshold rectangular, applied depolarizing currents, lasting 10 ms are shown inset, where the larger current represents a change in holding current of 400 pA. Beneath are plotted the total transmembrane currents for both responses (bottom of left hand panel). The supra-threshold response includes a regenerative Na+ current. Addition of persistent Na+ current with a maximal conductance of 100 nS dramatically reduced the applied current threshold and the action potential was elicited with a more negative voltage threshold (right hand panel). The regenerative inward current (and the action potential upswing) occurs after the applied depolarizing current has ceased (bottom of right-hand panel). B, up-regulation of persistent Na+ current gives rise to repetitive firing in response to a prolonged, just-supratheshold depolarization, a response not seen in the control neurone lacking the conductance. Initially the membrane potential was held at −90 mV by polarizing current and depolarization was brought about by a 34 pA change in holding current. The most negative interspike potential was close to −70 mV. C, simulation of a neurone with an input resistance of 2 GΩ, giving a resting membrane potential (without persistent Na+ conductance) of −58.4 mV (control). Addition of persistent Na+ conductance with a maximal value of 38 nS and with the simultaneous addition of a steady 60.5 pA hyperpolarizing ‘pump current’ produces a train of action potentials.

References

    1. Akopian AN, Souslova V, England S, Okuse K, Ogata N, Ure J, Smith A, Kerr BJ, McMahon SB, Boyce S, Hill R, Stanfa LC, Dickenson AH, Wood JN. The tetrodotoxin-resistant sodium channel SNS has a specialized function in pain pathways. Nat Neurosci. 1999;2:541–548. - PubMed
    1. Baker MD, Bostock H. Low-threshold, persistent sodium current in rat large dorsal root ganglion neurons in culture. J Neurophysiol. 1997;77:1503–1513. - PubMed
    1. Baker MD, Chandra SY, Ding Y, Waxman SG, Wood JN. GTP-induced tetrodotoxin-resistant Na+ current regulates excitability in mouse and rat small diameter sensory neurones. J Physiol. 2003;548:373–382. - PMC - PubMed
    1. Baker MD, Wood JN. Involvement of Na+ channels in pain pathways. Trends Pharmacol Sci. 2001;22:27–31. - PubMed
    1. Black JA, Waxman SG. Molecular identities of two tetrodotoxin-resistant sodium channels in corneal axons. Exp Eye Res. 2002;75:193–199. - PubMed

Publication types

LinkOut - more resources