Comparative Study
. 2005 Jul 19;102(29):10123-8.
doi: 10.1073/pnas.0504500102. Epub 2005 Jul 7.

Identification of mammalian arginyltransferases that modify a specific subset of protein substrates

Affiliations
Comparative Study

Identification of mammalian arginyltransferases that modify a specific subset of protein substrates

Reena Rai et al. Proc Natl Acad Sci U S A. .

Abstract

Posttranslational N-terminal protein arginylation, mediated by Arg-tRNA-protein transferase 1 (ATE1), is essential for cardiovascular development and angiogenesis in mammals but is nonessential in yeast. Evidence suggests that many proteins are arginylated in vivo in both mammals and yeast; however, in yeast, N-terminal arginylation can occur only on proteins bearing an N-terminal Asp or Glu, whereas in mammals, N-terminal Cys residues are also arginylation targets, suggesting that Cys arginylation contributes to the essential role of ATE1 in mammals. To date, all of the characterized forms of ATE1 in yeast and mammals have been shown to arginylate only Asp and Glu, leaving open to speculation whether Cys arginylation is possible only through other components of mammalian arginylation machinery and whether Cys-specific forms of Arg-transferase exist in mammals. Here, we report the identification of two forms of Arg-transferase in mice that are specific for N-terminal Cys. We also show that the two previously identified mammalian forms of ATE1 can arginylate Cys-containing substrates in addition to Asp- and Glu-containing substrates. This finding provides insights into the significance of Cys-specific protein arginylation in mammals and suggests possibilities of the determinants of substrate specificity within the ATE1 molecule.


Figures

Fig. 1.
Fig. 1.
Identification of mouse ATE1-3 and ATE1-4. (Top) A diagram representing the intron-exon structure of the mouse Ate1 gene, which is encoded by a 200-kb sequence on chromosome 7, containing a total of 14 exons. Four ATE1 forms are produced by alternative splicing of exons 1 and 2 and exons 8 and 9. (Middle) Schematic representation of cDNAs of ATE1 alternatively spliced forms. Exons encoding the corresponding cDNA sequences are listed on the top. (Bottom) Sequence alignment of the alternatively spliced exons reveals high homology among mouse ATE1 forms. The boxed motif CGYC, previously shown to be critical for ATE1 activity, is present in all four forms. *, Identical residues in all four forms;: and. denote residues with higher and lower degrees of homology, respectively.
Fig. 2.
Fig. 2.
Mouse ATE1 forms have different patterns of tissue-specific expression and intracellular localization. (A) RT-PCR of embryonic and adult mouse tissues using sets of primers specific for individual ATE1 forms. Whereas ATE1-2 is ubiquitously expressed and ATE1-1 is present throughout embryogenesis and adulthood, ATE1-3 and ATE1-4 show distinct patterns of tissue and developmental-stage expression and are present mostly in select adult tissues. (B) Intracellular localization of GFP fusions of ATE1-3 and ATE1-4 in wild-type mouse embryonic fibroblasts. Whereas ATE1-4 localizes uniformly in the cytoplasm and is always excluded from the nucleus, ATE1-3 has three distinct localization patterns: cell body and leading edge, uniformly in the nucleus and cytoplasm, or enriched in the nucleus.
Fig. 3.
Fig. 3.
ATE1-3 and ATE1-4, unlike ATE1-1, are unable to arginylate substrates with N-terminal Asp or Glu. Liquid assays of β-gal substrates in wild-type yeast (y) or in ate1Δ yeast mutants in the presence of mouse ATE1-1 (1), ATE1-3 (3) or ATE1-4 (4). Letters on the bottom of the chart (M, C, D, E, and R) correspond to the amino acid residue in the N-terminal position of each β-gal substrate. In yeast, substrates containing N-terminal Met (M) and Cys (C) are stable, whereas substrates containing N-terminal Arg (R) are highly unstable, resulting in dramatic reduction of β-gal activity. In the presence of ATE1, β-gal substrates containing N-terminal arginylatable residues receive an Arg, resulting in their destabilization and rapid degradation, which can be detected by the loss of β-gal activity. In this assay, Asp (D)- and Glu (E)-containing substrates get destabilized in the presence of yeast ATE1 or mouse ATE1-1, suggesting that these ATE1 forms can arginylate the corresponding β-gal-derived substrates, whereas ATE1-3 and ATE1-4 have no effect on β-gal stability, suggesting that they are not able to arginylate Asp, Glu, or Cys in yeast. β-gal activity is represented as the percentage of activity of M-containing substrate for each data set. Bars represent the average of seven independent experiments.
Fig. 4.
Fig. 4.
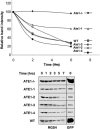
Mouse ATE1 forms are able to arginylate substrates with N-terminal Cys. (Upper) the quantification results of RGS4 levels in cells incubated with cycloheximide (to inhibit de novo protein synthesis) at increased time intervals. Mouse Ate1-/- embryonic fibroblasts were cotransfected with mouse RGS4 and either pEGFP-N2 vector (negative control) or one of the ATE1 forms, followed by cell collection at various time intervals and quantification of RGS4 levels by immunoblotting. For positive control, wild-type mouse embryonic fibroblasts were cotransfected with pEGFP-N2 and RGS4. RGS4 levels were quantified at 0, 1, 2, 3, 5, and 7 h after cycloheximide addition in five independent experiments for ATE1-1 and ATE1-2 and three independent experiments for controls and ATE1-3 and ATE1-4. To obtain the best fitted curves, RGS4 readings were first averaged between experiments and then averaged between two neighboring time intervals as follows: 0 + 1h = 0 time point on the curve, 2 + 3h = 2 h time point on the curve, and 5 + 7h = 6 h time point on the curve. RGS4 levels were calculated as the percentage of 0 time point. (Lower) Images of representative immunoblots quantified in the chart. (Left) RGS4 immunoblots at the corresponding time intervals (indicated on the top) for Ate1-/-, ATE1 forms, and Ate1+/+ cells. (Right) Anti-GFP immunoblots at 0 time point. For each ATE1 form ≈80-kDa fusion protein was present in approximately equal amounts throughout the experiment. In control cells, the ≈27-kDa GFP protein was present at extremely high levels, reflecting the elevated efficiency of GFP expression in the absence of N-terminal fusion.

References

    1. Kaji, A., Kaji, H. & Novelli, G. D. (1963) Biochem. Biophys. Res. Commun. 10, 406-409. - PubMed
    1. Balzi, E., Choder, M., Chen, W. N., Varshavsky, A. & Goffeau, A. (1990) J. Biol. Chem. 265, 7464-7471. - PubMed
    1. Kaji, H. (1968) Biochemistry 7, 3844-3850. - PubMed
    1. Soffer, R. L. (1973) J. Biol. Chem. 248, 2918-2921. - PubMed
    1. Li, J. & Pickart, C. M. (1995) Biochemistry 34, 15829-15837. - PubMed

Publication types

Substances

Associated data