Comparative Study
. 2005 Jul 7;272(1570):1305-14.
doi: 10.1098/rspb.2005.3101.

Electric organ discharge patterns during group hunting by a mormyrid fish

Affiliations
Comparative Study

Electric organ discharge patterns during group hunting by a mormyrid fish

Matthew E Arnegard et al. Proc Biol Sci. .

Abstract

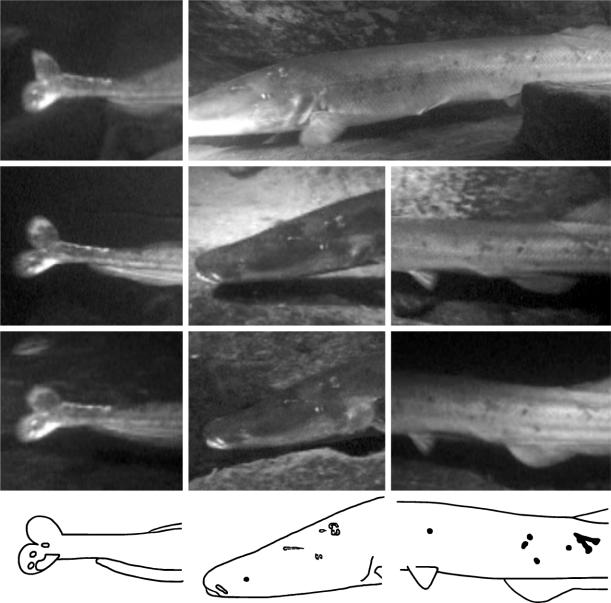
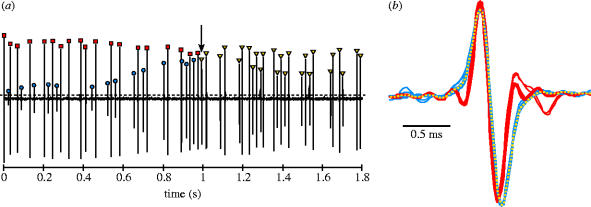
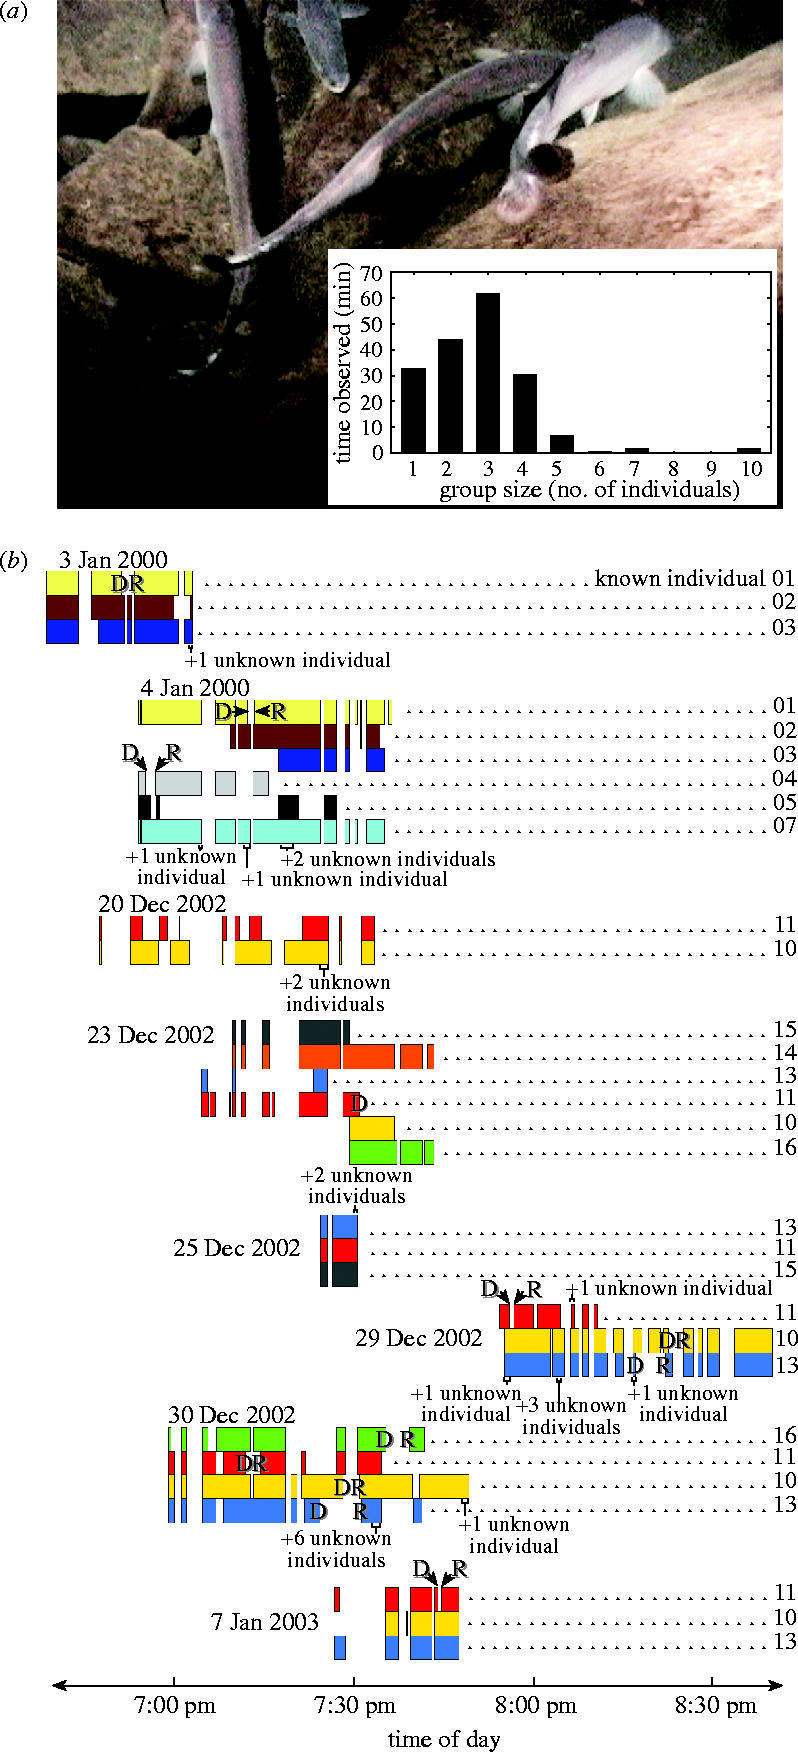
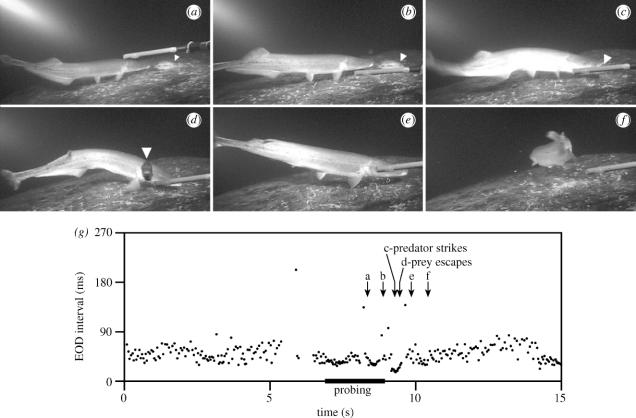
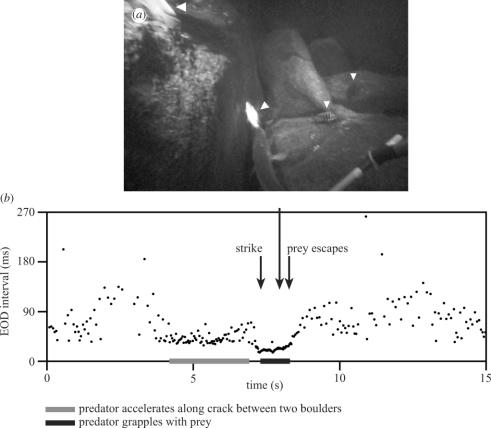
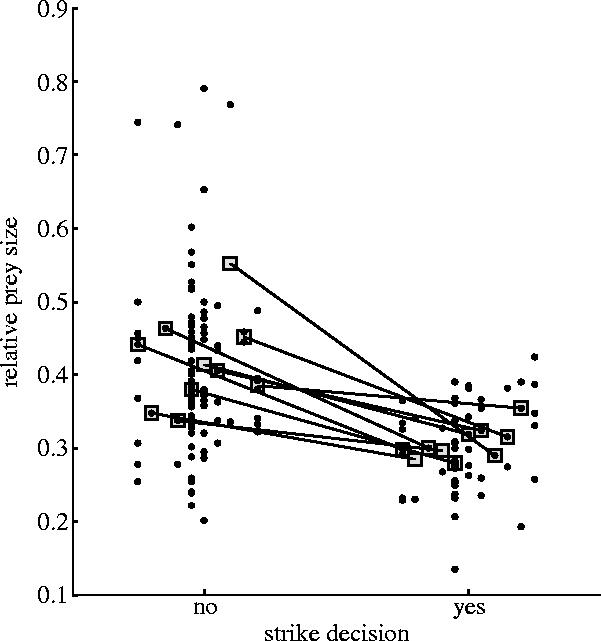
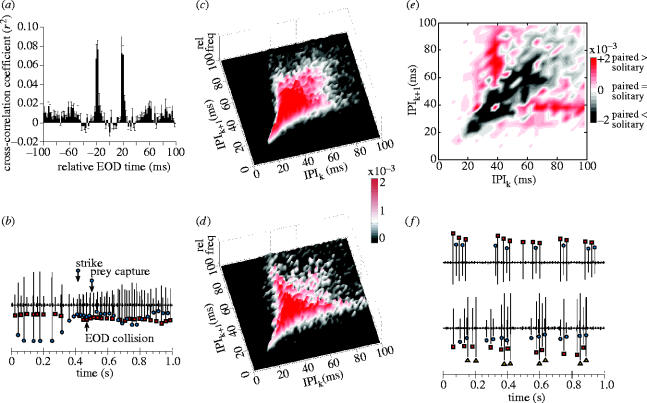
Weakly electric fish emit and receive low-voltage electric organ discharges (EODs) for electrolocation and communication. Since the discovery of the electric sense, their behaviours in the wild have remained elusive owing to their nocturnal habits and the inaccessible environments in which they live. The transparency of Lake Malawi provided the first opportunity to simultaneously observe freely behaving mormyrid fish and record their EODs. We observed a piscivorous mormyrid, Mormyrops anguilloides, hunting in small groups in Lake Malawi while feeding on rock-frequenting cichlids of the largest known vertebrate species flock. Video recordings yielded the novel and unexpected finding that these groups resembled hunting packs by being largely composed of the same individuals across days. We show that EOD accelerations accompany prey probing and size estimation by M. anguilloides. In addition, group members occasionally synchronize bursts of EODs with an extraordinary degree of precision afforded by the mormyrid echo response. The characteristics and context of burst synchronization suggest that it may function as a pack cohesion signal. Our observations highlight the potential richness of social behaviours in a basal vertebrate lineage, and provide a framework for future investigations of the neural mechanisms, behavioural rules and ecological significance of social predation in M. anguilloides.


Figures

Figure 1
Figure 1
Examples of body markings used to identify individuals. Video captures from different nights (rows) are shown for three sets of distinctive characters (aligned vertically) present in the same individual. Line drawings from the bottom row of photos summarize the character sets used to identify this individual: left, three spots and a larger white patch on the lower caudal fin lobe; middle, six scars and a white snout marking on the left side of the head; and right, a V-shaped patch and several dark spots on the left flank.
Figure 2
Figure 2
Example of the method used to detect and discriminate EOD times of occurrence. (a) Short segment of a low-pass filtered continuous electrical recording of two individuals (videotaped together). EODs (marked by symbols) are detected as positive peaks in the electrical recording that exceed a manually set threshold (dashed horizontal line). (b) Overlays of all EODs up to the point in (a) marked by the arrow. EODs are centred on their head-positive peak with peak-to-peak amplitude normalized (head-positive plotted upwards). Starting with the first EOD in the sequence (arbitrarily designated as individual i), the expanded EOD waveform is displayed and colour coded red. The next EOD is then superimposed on the previous EOD. Based on visual comparison of waveforms, the second EOD is assigned to individual ii and colour coded blue. The third EOD is then superimposed on all preceding EODs and, in this case, assigned to individual i. This sequence is continued until all EODs in the record have been assigned. The arrow in (a) indicates the yellow EOD waveform currently being inspected in (b), which would be assigned to individual ii.
Figure 3
Figure 3
Gregarious hunting by M. anguilloides. (a) Group of four individuals searching for prey; (inset) size distribution of hunting groups. (b) Tracings constructed from all video recordings of continuously swimming individuals in search of prey. Placement and width of rectangles (coloured differently for unique individuals) indicate time of day and sighting duration for predators composing coherent groups whenever simultaneously recorded. ‘Known’ individuals that simultaneously entered (or exited) the recordist's field of observation, causing gaps in the tracings, were first (or last) seen swimming together in the same general direction and at the same approximate speed. Brief sightings are also shown for ‘unknown’ (i.e. non-focal) groups or individuals (also with distinctive body markings) that were not followed. ‘D’ and ‘R’ refer to stereotyped, rapid departure responses of single individuals upon prey capture and their eventual return to their same group, respectively.
Figure 4
Figure 4
Video recording and SPI of a solitary predator during a typical hunting sequence. Still frames show: (a,b) stationary probing directed at a cichlid (white triangle); (c) strike attempt; (d) rapid prey escape towards the camera; and (e,f) resumption of searching by the predator. The recording electrode is visible in the foreground. (g) SPI during the same behavioural sequence (frame times marked by arrows; duration of stationary probing indicated by the black bar). A drop in intervals near the end of the plot corresponds to the probing of a second cichlid (also followed by an unsuccessful strike).
Figure 5
Figure 5
(a) Video capture of a predation attempt showing the position of four cichlids (white triangles). (b) SPI during the capture attempt. In this example, the predator accelerated its swimming speed towards a cichlid hiding in a crack between two boulders, while reducing and regularizing its EOD intervals. The predator further decreased its EOD intervals when it struck at the prey and temporarily captured it. The predator briefly grappled with the prey, but the cichlid escaped and fled.
Figure 6
Figure 6
Relative prey sizes for two categories of predatory behaviour: strike decision= ‘no’; strike decision=‘yes’. Within each category, points corresponding to the same predator are aligned vertically and dithered relative to those of other individuals. Five strike attempts by ‘unknown’ individuals (see figure 3) are plotted at the far right. Prey size differs significantly between categories, whether predator medians (boxes connected by lines; p=0.0051; Wilcoxon paired-sample test) or all prey (p<0.000 01; Mann–Whitney U test) are compared.
Figure 7
Figure 7
Interactions in EOD output of multiple predators. (a) Mean cross-correlation histogram of EOD occurrence times (±s.e.m.; n=8 pairs). (b) Voltage trace recorded from two hunting fish (different symbols mark the EODs of each individual). Reciprocal echoing at the beginning of the trace broke down and a collision of EODs occurred when both individuals increased their EOD output rates upon encountering a cichlid. Neither predator performed ‘stationary probing’. One predator captured the cichlid and rapidly departed. (c) Surface plot showing a JIH of pulse interval data from 13 video clips of solitary hunters (15 398 EOD intervals total). Each interpulse interval (IPIk+1) is plotted as a function of the preceding interval (IPIk), and the relative frequencies within each bin are indicated by surface height and colour (bin width=2 ms). (d) Same plot as in (c) but for pulse interval data from eight video sequences of paired hunters (5766 EOD intervals total). The colour bar (to the right, between (c) and (d)) is the relative frequency scale for both plots. (e) Contour plot of the difference between (d) and (c) (paired hunter JIH – solitary hunter JIH; bin width=4 ms). Contour height (red, positive difference) or depth (grey, negative difference) is indicated by the colour bar to the right. (f) Two examples of synchronized bursting: (upper voltage trace) between two individuals upon encountering one another after a brief separation during hunting; (lower trace) among three individuals in their cave shelter during a pause from hunting.

References

    1. Baird R.W, Whitehead H. Social organization of mammal-eating killer whales: group stability and dispersal patterns. Can. J. Zool. 2000;78:2096–2105.
    1. Bradbury J.W, Vehrencamp S.L. Sinauer; Sunderland, MA: 1998. Principles of animal communication.
    1. Brockmann H.J, Barnard C.J. Kleptoparasitism in birds. Anim. Behav. 1979;27:487–514.
    1. Bshary R, Wickler W, Fricke H. Fish cognition: a primate's eye view. Anim. Cogn. 2002;5:1–13. - PubMed
    1. Carlson B.A. Electric signaling behavior and the mechanisms of electric organ discharge production in mormyrid fish. J. Physiol. (Paris) 2002;96:405–419. - PubMed

Publication types

LinkOut - more resources