. 2005 Jul 19;102(29):10035-9.
doi: 10.1073/pnas.0504712102. Epub 2005 Jul 8.

Space- and time-resolved spectrophotometry in microsystems

Affiliations

Space- and time-resolved spectrophotometry in microsystems

Nicolae Damean et al. Proc Natl Acad Sci U S A. .

Abstract

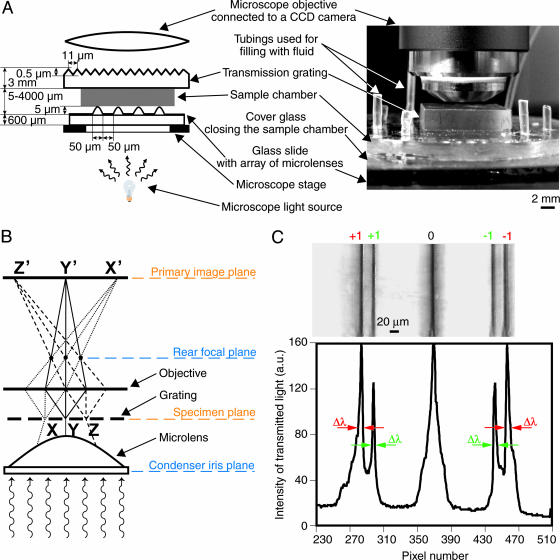
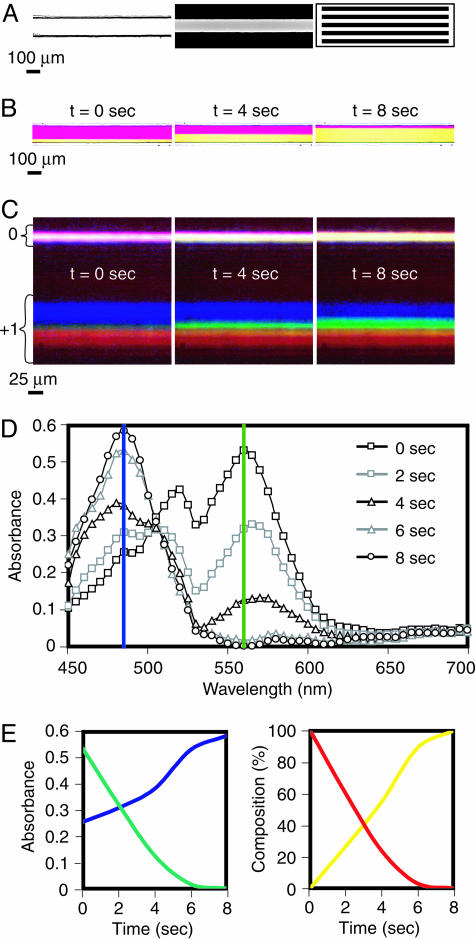
This work describes a simple optical method for obtaining, in a single still-capture image, the continuous absorbance spectra of samples at multiple locations of microsystems. This technique uses an unmodified bright-field microscope, an array of microlenses, and a diffraction grating to disperse the light transmitted by samples of 10- to 500-microm dimensions. By analyzing in a single image the first-order diffracted light, it is possible to collect the full and continuous absorbance spectra of samples at multiple locations (to a spatial resolution of approximately 8 microm) in microwells and microchannels to examine dynamic chemical events (to a time resolution of <10 ms). This article also discusses the optical basis of this method. The simultaneous resolution of wavelength, time, and space at a scale <10 microm provides additional capabilities for chemical and biological analysis.


Figures

Fig. 1.
Fig. 1.
Setup of μPS. (A) Schematic diagram and photograph of the setup. (B) Illumination pathway of the optical setup in this study that leads to facile imaging of the diffraction spectrum by using a bright-field microscope. In a regular arrangement for observing diffraction in a microscope, the objective lens is focused on the grating; as a result, an image of the grating forms at the primary image plane (and can be observed via the eyepiece), and an image of the diffracted light forms at the rear focal plane of the objective lens (and can be observed by using a Bertrand lens). In this study, we removed the condenser of the microscope from the light path and used the microlenses as minicondensers. By focusing the objective lens near the microlenses rather than the grating, the optical plane of the condenser iris (which is conjugate to the rear focal plane; both conjugate planes are shown in blue) becomes nearly coplanar with the specimen plane (which is conjugate to the primary image plane; both conjugate planes are shown in orange). As a result, the image of the diffracted light, which is normally observed only in the rear focal plane, also forms on the primary image plane, and is easily captured by a black-and-white CCD camera in a bright-field microscope. (C) Determination of spectral resolution using lasers. (Upper) In the optical image of the diffraction spectrum, numbers correspond to the diffracted orders, and colors correspond to the wavelengths. (Lower) In the processed spectrum of intensity vs. pixel number, the arrows point to the full-width half-maxima that were measured as Δλ, and used to calculate R; the colors correspond to the wavelengths.
Fig. 2.
Fig. 2.
Diffraction patterns generated by μPS. (A) Optical micrograph of an array of spherical microlenses (50 μm in diameter, spaced at 100-μm pitch) (Left), a schematic of a transmission grating (92 grooves per mm; the grooves are not drawn to scale for clarity) (Left Inset), and a recorded image of the diffraction spectra (Right). The diagrams show the orientation of the transmission grating with respect to the microlens. For clarity of visualization, a color CCD camera was used to image the spectra, and no sample chamber was used (such that the diffraction grating lay directly on top of the microlenses). Three orders of diffraction (0, 1, and -1) are visible for each microlens. The image was taken with an objective lens of ×20 magnification. (B) As with A, but with a straight cylindrical microlens. (C) As with A, but with a cylindrical microlens with a right-angle turn. The images in B and C were taken with an objective lens of ×40 magnification.
Fig. 3.
Fig. 3.
Quantitative characterization of μPS. (A) Comparison of wavelength spectra of 6.0 mM bromophenol blue as measured by μPS and a benchtop spectrophotometer. (B) Comparison of absorbance values measured by μPS and a benchtop spectrophotometer, for different concentrations of bromophenol blue (from 0.4 to 6.0 mM). The absorbance values were measured at 595 nm, the absorption maximum of bromophenol blue.
Fig. 4.
Fig. 4.
Use of μPS to measure simultaneously the visual spectra of dyes in multiple microwells. (A) Optical micrograph of an array of cylindrical microlenses, and a schematic of transmission grating (with its orientation with respect to the microlenses) (Inset). (B) Optical micrograph of a system of four microwells (90 μm deep) filled with dyes. For the four microwells, from left to right, the dyes are bromophenol blue (BPB), orange green (OG), Janus green (JG), and MQ water as a blank. (C) Recorded images of the diffracted spectra (only 0 and +1 orders are shown) with a color CCD camera.
Fig. 5.
Fig. 5.
Monitoring of dynamic events in a laminar flow experiment using μPS. (A) Optical micrographs of a microchannel (Left) and a microlens aligned to the microchannel (Center), and a schematic diagram of a transmission grating (Right) with the grooves parallel to the microchannel. (B) Optical micrographs of laminar flow of fluorescein and sulforhodamine B in a microchannel. (C) Images of the diffraction spectra with different compositions of dyes in the microchannel (which can be roughly observed in the zeroth-order spectra). The zeroth- and first-order diffracted spectra are shown. For clarity of visualization, color images are shown. (D) Absorbance spectra of a specific location in the microchannel, as a change in flow rates fills a microchannel primarily with sulforhodamine B to one filled primarily with fluorescein, over the course of 8 s. (E) (Left) The absorbance values recorded at 485 nm (blue) and 560 nm (green) over the course of the switching of flow rates. (Right) The percentage composition of fluorescein (yellow) and sulforhodamine B (red) in the microchannel during the experiment.

Similar articles

Cited by

References

    1. Vilkner, T., Janasek, D. & Manz, A. (2004) Anal. Chem. 76, 3373-3386. - PubMed
    1. Losey, M. W., Schmidt, M. A. & Jensen, K. F. (2001) Ind. Eng. Chem. Res. 40, 2555-2562.
    1. Chou, H., Spence, C., Scherer, A. & Quake, S. R. (1999) Proc. Natl. Acad. Sci. USA 96, 11-13. - PMC - PubMed
    1. Dunn, D. A. & Feygin, I. (2000) Drug Discovery Today 5, S84-S91. - PubMed
    1. Huang, L. R., Cox, E. C., Austin, R. H. & Sturm, J. C. (2004) Science 304, 987-990. - PubMed

Publication types

LinkOut - more resources