. 2005 Aug;8(8):1110-6.
doi: 10.1038/nn1501. Epub 2005 Jul 10.

Stimulus context modulates competition in human extrastriate cortex

Affiliations

Stimulus context modulates competition in human extrastriate cortex

Diane M Beck et al. Nat Neurosci. 2005 Aug.

Abstract

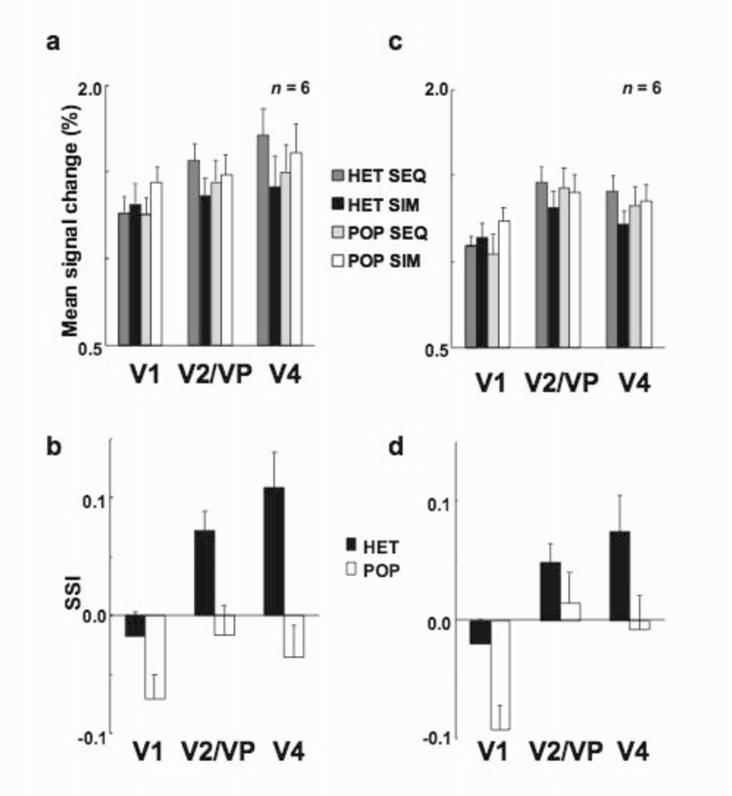
When multiple stimuli appear simultaneously in the visual field, they are not processed independently, but rather interact in a mutually suppressive way, suggesting that they compete for neural representation in visual cortex. The biased competition model of selective attention predicts that the competition can be influenced by both top-down and bottom-up mechanisms. Directed attention has been shown to bias competition in favor of the attended stimulus in extrastriate cortex. Here, we show that suppressive interactions among multiple stimuli are eliminated in extrastriate cortex when they are presented in the context of pop-out displays, in which a single item differs from the others, but not in heterogeneous displays, in which all items differ from each other. The pop-out effects seemed to originate in early visual cortex and were independent of attentional top-down control, suggesting that stimulus context may provide a powerful influence on neural competition in human visual cortex.


Figures

Figure 1.
Figure 1.
Experimental design and stimuli. Four Gabor stimuli were presented in four nearby locations in the periphery of the upper right quadrant as (a) pop-out displays, in which a single item differed in color and orientation from the others, or (b) heterogeneous displays, in which all four stimuli differed in color and orientation. These stimuli were presented either (c) sequentially or (d) simultaneously. (c-d) A stimulation period of 1 s, which was repeated in blocks of 18 s, is shown for a heterogeneous display. Stimuli were presented for 250 ms, followed by a blank period of 750 ms, on average, in each location. During all conditions, subjects detected target letters at fixation (illustrated in lower left corner of each display).
Figure 2.
Figure 2.
Time series of fMRI signals in visual cortex (Experiment 1). Group analysis (n = 10). Solid curves indicate activity evoked by sequential presentations and dashed curves that evoked by simultaneous presentations for (a) heterogeneous displays and (b) pop-out displays.
Figure 3.
Figure 3.
Mean signal changes and SSIs in visual cortex (Experiment 1). (a) Mean signal changes for each area and each of the four conditions were averaged across subjects (n = 10). For each subject, mean signal change was defined as the average of the nine peak intensities of the fMRI signal obtained during visual presentations. Asterisks indicate significant differences (p<.05). (b) Sensory suppression indexes (SSIs) were derived from the data shown in (a). Vertical bars indicate S.E.M.
Figure 4.
Figure 4.
Mean signal changes in visual cortex (Experiment 2). Mean signal changes, defined as described in Fig. 3, were averaged across subjects (n = 6) for each presentation condition of the homogeneous and pop-out displays. Asterisks indicate significant differences (p<.05).
Figure 5.
Figure 5.
Effects of pop-out and directed attention on suppressive interactions in human visual cortex. SSIs obtained for areas V1 (squares), V2/VP (triangles), and V4 (circles) are plotted for the current study, probing bottom-up effects of pop-out on suppressive interactions, (filled symbols) and for a study that probed the top-down effects of directed attention on suppressive interactions (open symbols). The horizontal axis represents the SSIs obtained for heterogeneous display conditions from the two studies, when the peripheral stimuli were unattended. The vertical axis represents the SSIs obtained for the pop-out display condition from the present study and the directed attention condition from the previous study to directly compare the top-down and bottom-up effects on suppressive interactions. The dashed line represents the points at which the two indices are equal, indicating no modulation of suppressive interactions by top-down or bottom-up influences.
Supplementary Figure 1.
Mean signal changes and SSIs obtained with the two fixation tasks. Mean signal changes for each area and each of the four stimulus conditions were averaged across subjects in the version of the fixation task that required subjects to count target letters (a) and in the version that required them to respond with a button press (b). Conventions are the same as in Figures 3 and 4. (c-d) Sensory suppression indexes (SSIs) were derived from the data shown in (a) and (b), respectively. Vertical bars indicate S.E.M.

Comment in

References

    1. Broadbent DE. Perception and Communication. Pergamon, London: 1958.
    1. Desimone R, Duncan J. Neural mechanisms of selective visual attention. Annu. Rev. of Neurosci. 1995;18:193–222. - PubMed
    1. Duncan J. Converging levels of analysis in the cognitive neuroscience of visual attention. Philos Trans R Soc Lond B Biol Sci. 1998;353:1307–17. - PMC - PubMed
    1. Miller EK, Gochin PM, Gross CG. Suppression of visual responses of neurons in inferior temporal cortex of the awake macaque by addition of a second stimulus. Brain Res. 1993;616:25–29. - PubMed
    1. Reynolds JH, Chelazzi L, Desimone R. Competitive mechanisms subserve attention in macaque areas V2 and V4. J. Neurosci. 1999;19:1736–1753. - PMC - PubMed

Publication types